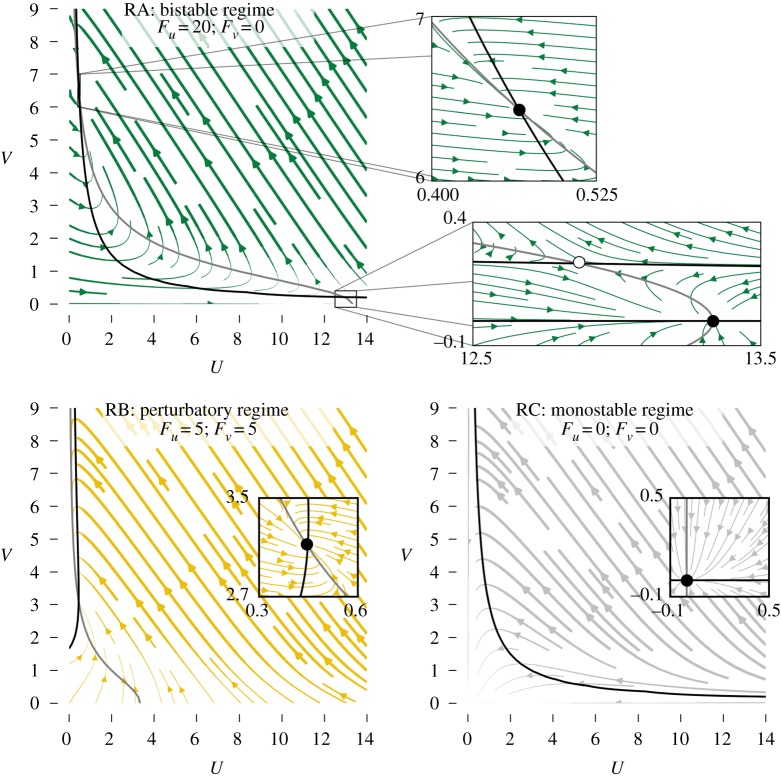
Figure 4.
Dynamics for three different parameter regimes of the cubic-autocatalytic chemical reaction represented by equations (3.1) and (3.2). V and U nullclines are indicated by black and grey curves, respectively. Filled and open circles represent stable and unstable fixed points, respectively. Note that in some insets, non-sensical negative values of U and V are shown to provide insight into the stability of the fixed points. (Online version in colour.)

