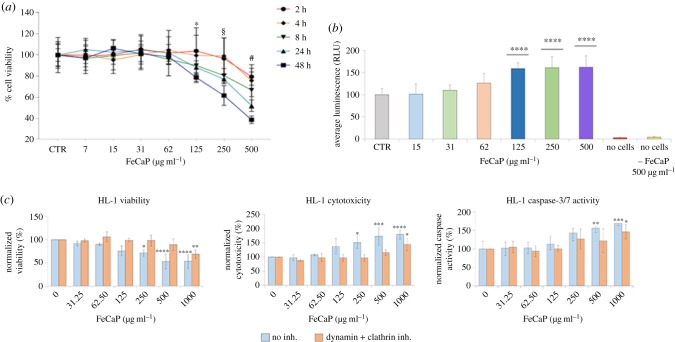
Figure 1.
Biocompatibility of FeHA to HL-1 cardiac cells: effects on cell viability, caspase 3/cytotoxicity and ROS production. (a) Cell toxicity as measured by the Real Time Glo assay in HL-1 cells treated as indicated during 48 h. Data are presented as mean ± s.d.; n = 9, in three independent experiments for each experimental condition. Using one-way ANOVA and Tukey's post hoc test, * indicates p < 0.05 significance for the 125 µg ml−1 FeHA dose after 48 h, § indicates p < 0.05 significance for the 250 µg ml−1 FeHA dose after 8, 24 and 48 h, and # indicates p < 0.01 significance for the 500 µg ml−1 FeHA dose after all timing treatments: 2, 4, 8, 24 and 48 h compared with control non-treated cells (CTR). (b) ROS production was used to evaluate FeHA-induced oxidative stress in HL-1 cardiac cells after 24 h treatment. Data are presented as mean ± s.d.; n = 9, in three independent experiments for each experimental condition. ****p < 0.0001 indicate significance calculated for each FeHA dose compared with CTR using one-way ANOVA and Tukey's post hoc test. (c) Correlation of viability, cytotoxic and apoptotic levels’ detection via the activated caspase 3/7 assay in HL-1 cells pretreated as indicated with clathrin and dynamin inhibitors and then with increasing concentrations of FeHA during 24 h. Data are presented as mean ± s.d.; n = 9, in three independent experiments for each experimental condition. *p < 0.05, **p < 0.01, ***p < 0.001 and ****p < 0.0001 indicate significance for each FeHA dose compared with CTR using two-way ANOVA and Tukey's post hoc test.

