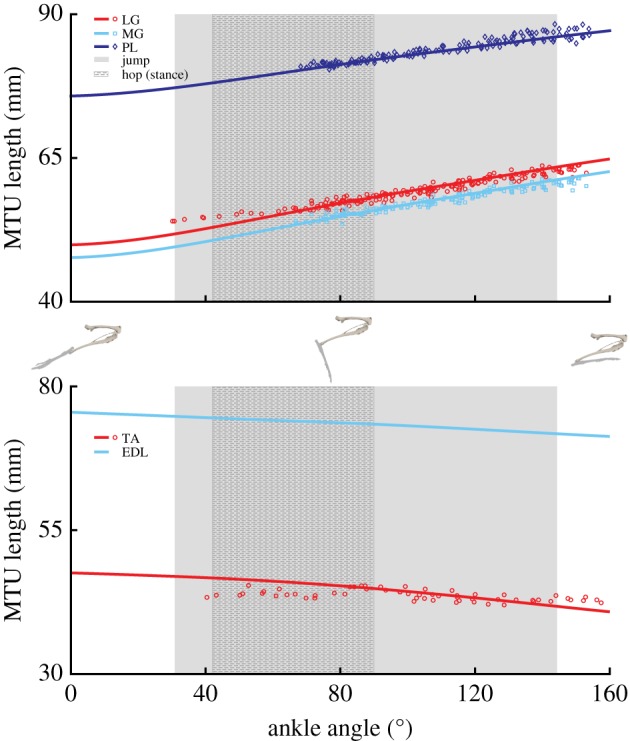
Figure 6.

Experimental (symbols) and model-generated (lines) musculotendon lengths of muscles crossing the ankle throughout the range of motion. Shaded areas represent the functional ankle range of motion during representative jumping and hopping (stance phase) movements. For definitions of abbreviations, see table 2. No experimental data were collected for EDL, but the model representation is provided here for completeness. Skeletal images provide a visual representation of the ankle joint angles at the range of motion midpoint and extremes. (Online version in colour.)
