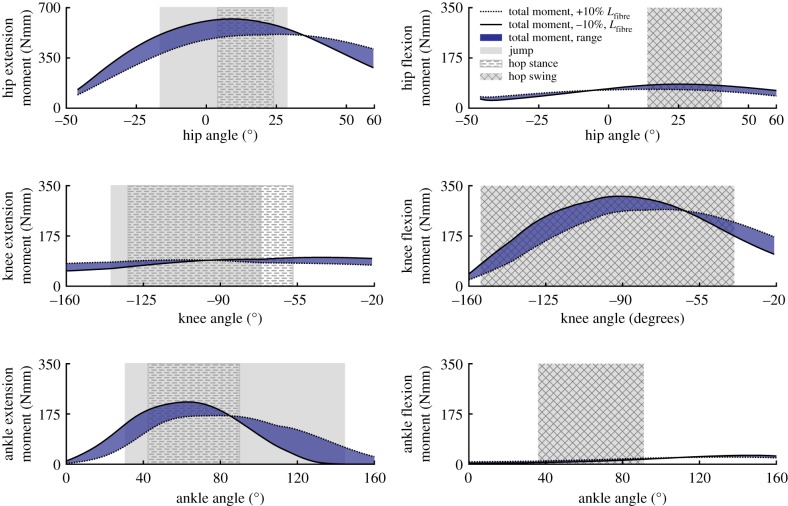
Figure 8.
Model estimates of maximum moment generating capacity of the combined hindlimb muscles over each joint range of motion. The shaded regions between the lines represent the range of possible capacities when accounting for ±10% errors in Lfibre. The joint angles used during jumping and hopping (stance & swing) are represented by the hatched, crossed, and grey rectangles. (Online version in colour.)

