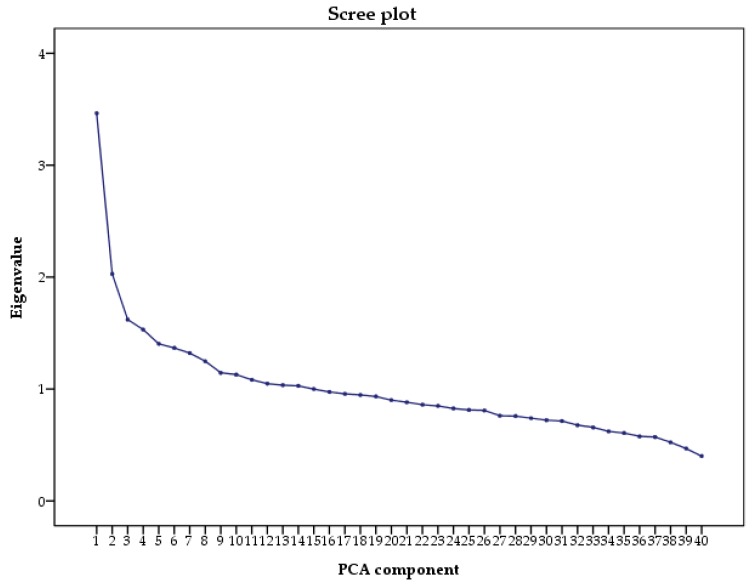
Figure 1.
Scree plot of the eigenvalues. We used the scree plot examination to determine the appropriate number of dietary pattern. Scree plot represents the partitioning of the total variation (i.e., eigenvalue) accounted for each principal component, against the principal component number. PCA: principal component analysis.

