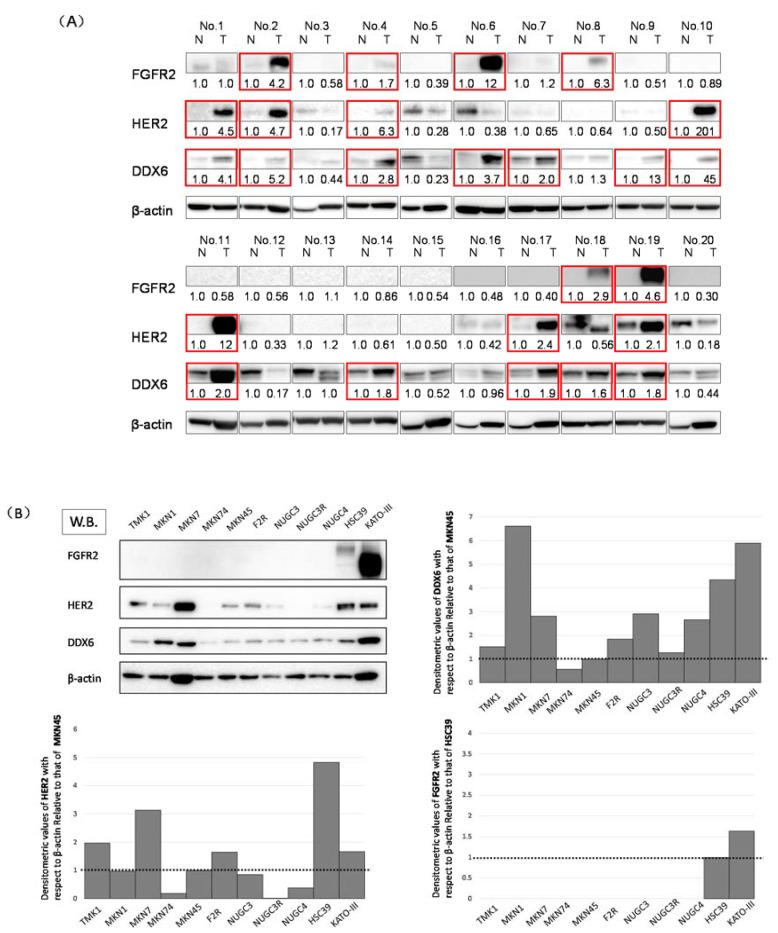
Figure 1.
The expression levels of DDX6, HER2, and FGFR2 in gastric cancer (GC) cell lines and GC clinical samples. (A) Western blots of the 20 clinical samples. The overexpression of DDX6, HER2, and FGFR2 in tumor samples is highlighted by red-boxes. N: normal, T: tumor in the same patient. Details of the characteristics of the patients are given in Table 1. Densitometric values of DDX6, HER2, and FGFR2 with respect to β-actin of each sample were calculated and the values are shown with each normal sample taken as 1.0. Densitometric values more than 1.5 are regarded as overexpressed. The cases that overexpressed DDX6, HER2, and FGFR2 are highlighted by red boxes; (B) Western blotting (W.B.) of the steady-state levels of DDX6, HER2, and FGFR2 in GC cell lines. Cell lines including TMK1, MKN1, MKN7, MKN74, MKN45, F2R (MKN45-5FU resistant [5FUR]), NUGC3, NUGC3-5FUR, NUGC4, HSC39, and KATO-III. In the expression levels of HER2 and DDX6, densitometric values of DDX6 with respect to β-actin of each sample were calculated and the values are shown with MKN45 taken as 1.0. In the case of FGFR2, the values are shown with HSC39 taken as 1.0.

