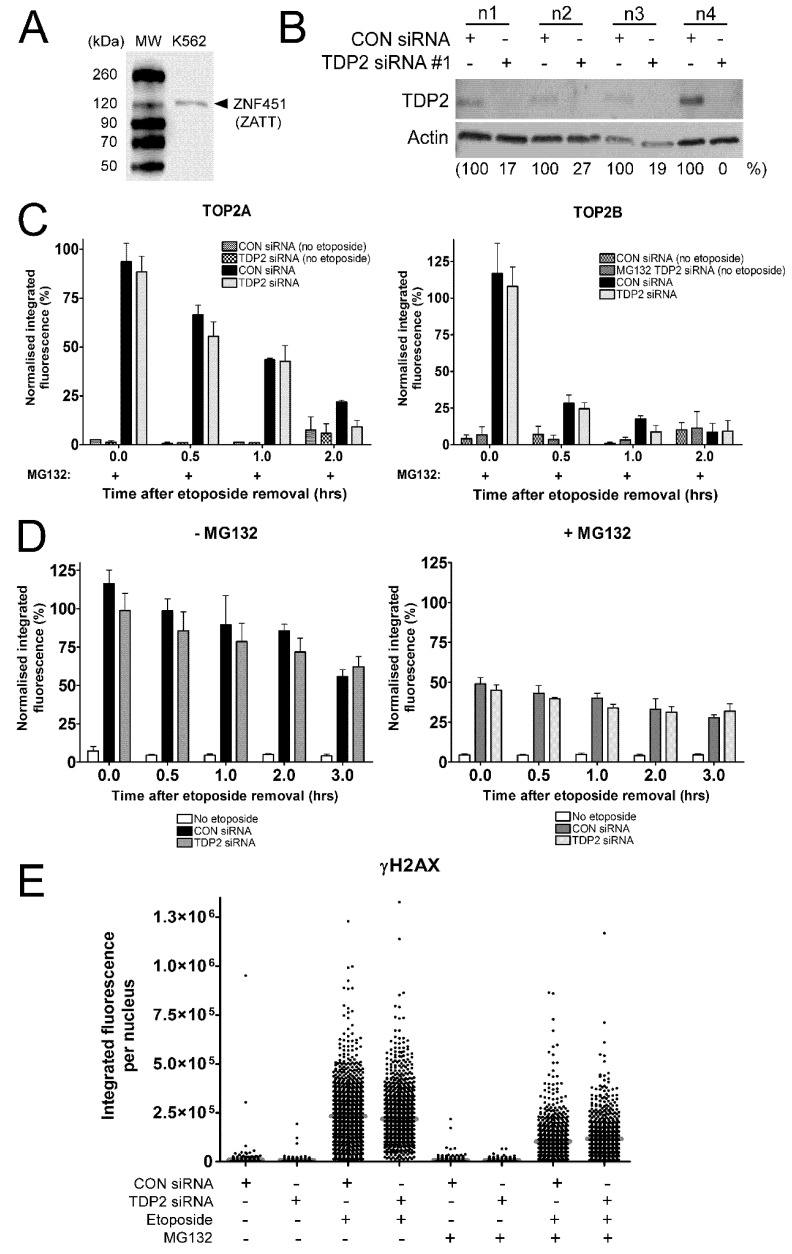
Figure 4.
Effect of TDP2 siRNA knockdown on levels of etoposide-induced TOP2-DNA complexes and histone H2AX phosphorylation following proteasomal inhibition. (A) Expression of the ZATT SUMO ligase (ZNF451) in K562 cells, shown by western blot. (B) siRNA-mediated knockdown of TDP2 in K562 cells from four biological replicates from experiments shown in Figure 4B,C. Cells were transfected with 500 nM TDP2 siRNA #1 or non-coding (CON) siRNA and used for TARDIS and ɣH2AX assay 72 h after electroporation. (C) Control or TDP2 siRNA knockdown cells were treated with 100 µM etoposide and 10 µM MG132 for 2 h, followed by incubation in etoposide-free medium containing MG132 for 0, 0.5, 1 or 2 h. Levels of TOP2A- and TOP2B- DNA complexes were measured using the TARDIS assay. Values are normalised to a 2 h 100 µM etoposide control and compared by two-way ANOVA (n = 4). (D) Control or TDP2 siRNA knockdown cells were treated with 100 µM etoposide alone or in combination with 10 µM MG132 for 2 h, followed by incubation in etoposide-free medium containing solvent or MG132 for 0, 0.5, 1, 2, or 3 h. Level of etoposide-induced histone H2AX phosphorylation was measured using the ɣH2AX assay. Values are normalised to a 2 h 100 µM etoposide control and compared by two-way ANOVA (n = 3). (E) Data from Figure 4D is presented as a scatter plot of raw integrated fluorescence values of ɣH2AX signal in individual cells (n = 1). Data is shown for CON siRNA and TDP2 siRNA knockdown cells treated continuously with 100 µM etoposide (or DMSO) for 2 h, alone or in combination with 10 µM MG132 as indicated.

