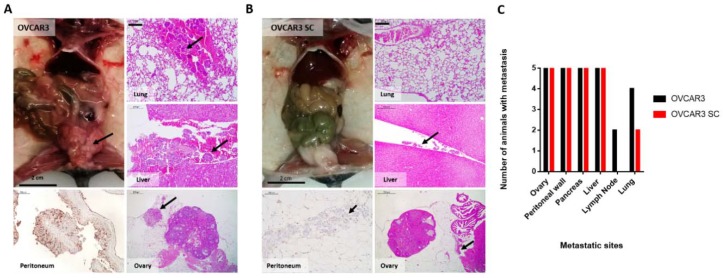
Figure 5.
OVCAR3 xenografts formed larger tumours than OVCAR3 SC. (A) OVCAR3 xenografts formed large tumours in the peritoneum and in the Douglas Sac (arrow). Representative metastatic sites shown by H&E stain of lung, liver, and ovary. Immunocytochemistry showing the expression of T antigen of parental OVCAR3 cells in the peritoneum. Arrows indicate areas of tumour aggregates; (B) OVCAR3 SC xenografts formed smaller tumours compared with parental OVCAR3. Representative metastatic sites shown by H&E stain of lung, liver, and ovary. Immunocytochemistry showing the absence of T antigen expression of OVCAR3 SC cells in the peritoneum. Arrows indicate areas of tumour aggregates; (C) The number of animals with metastasis in the ovary, peritoneum, pancreas, and liver capsule was the same for both cell lines (5/5). OVCAR3 were identified in the lymph nodes of 2/5 mice and in the lungs of 4/5 mice. OVCAR3 SC were absent in the lymph nodes and present in the lung of 2/5 mice. A total of five mice were used per condition. The scale bar on microscopic images represents 200 µm.

