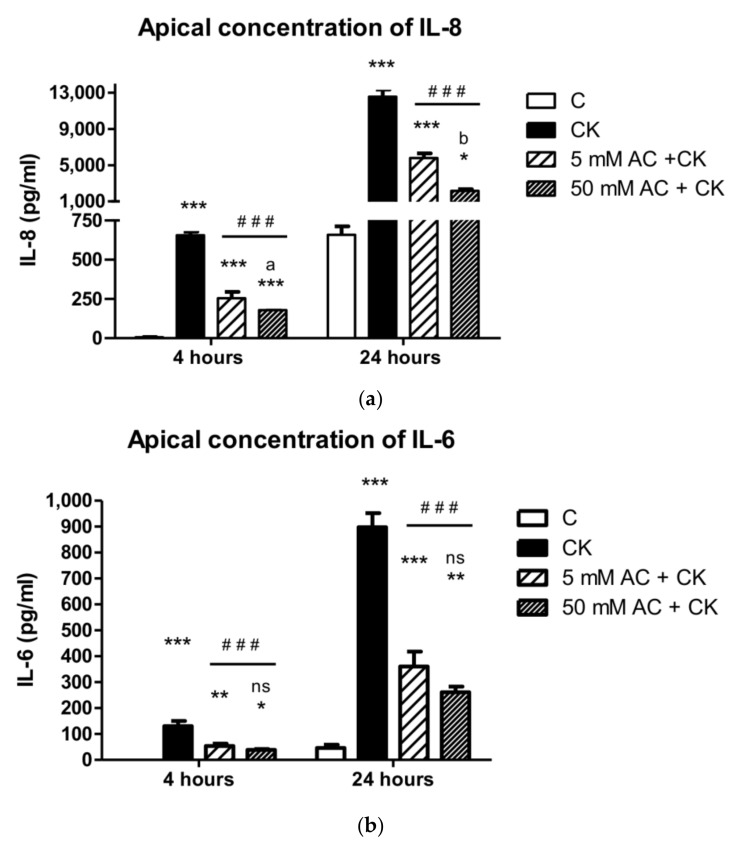
Figure 5.
Apical concentration of IL-8 (a) and IL-6 (b) after CK induction in medium. The control group (C) received culture medium. The monolayers were treated with 25 ng/mL IL-1β and 50 ng/mL TNF-α (CK) and pre-treated with 5 µM or 50 µM AC. Results are presented as means ± SDs, n = 3–5, *** p < 0.001, ** p < 0.01, * p < 0.05, ### p < 0.001. * represents CK and AC + CK compared to C; AC + CK compared to CK—represents #; a represents 5 µM AC + CK vs. 50 µM AC + CK, p < 0.05; b represents 5 µM AC + CK vs. 50 µM AC + CK, p < 0.001.

