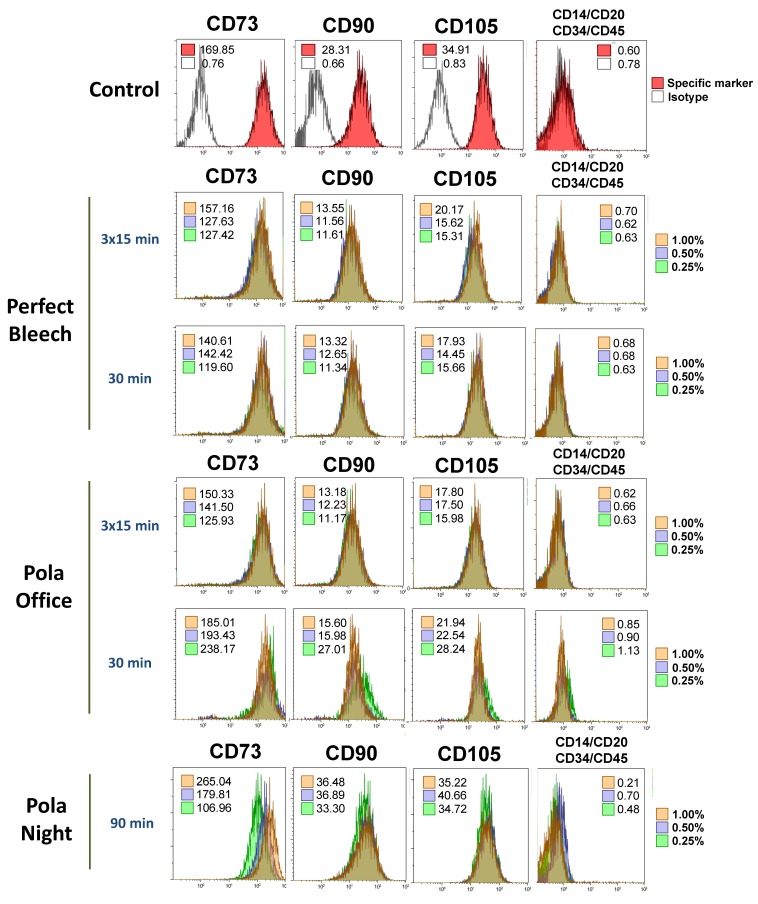
Figure 6.
Mesenchymal phenotype analysis of hDPSCs after culture with bleaching products using flow cytometry. Cells were cultured for 72 h, detached and labelled with fluorescence-conjugated specific antibodies for the mesenchymal surface markers CD73, CD90 and CD105 and the hematopoietic markers CD14, CD20, CD34 and CD45. Inset numbers represent the mean fluorescence intensity values of viable cells. Histograms show representative flow cytometry results from three independent experiments.

