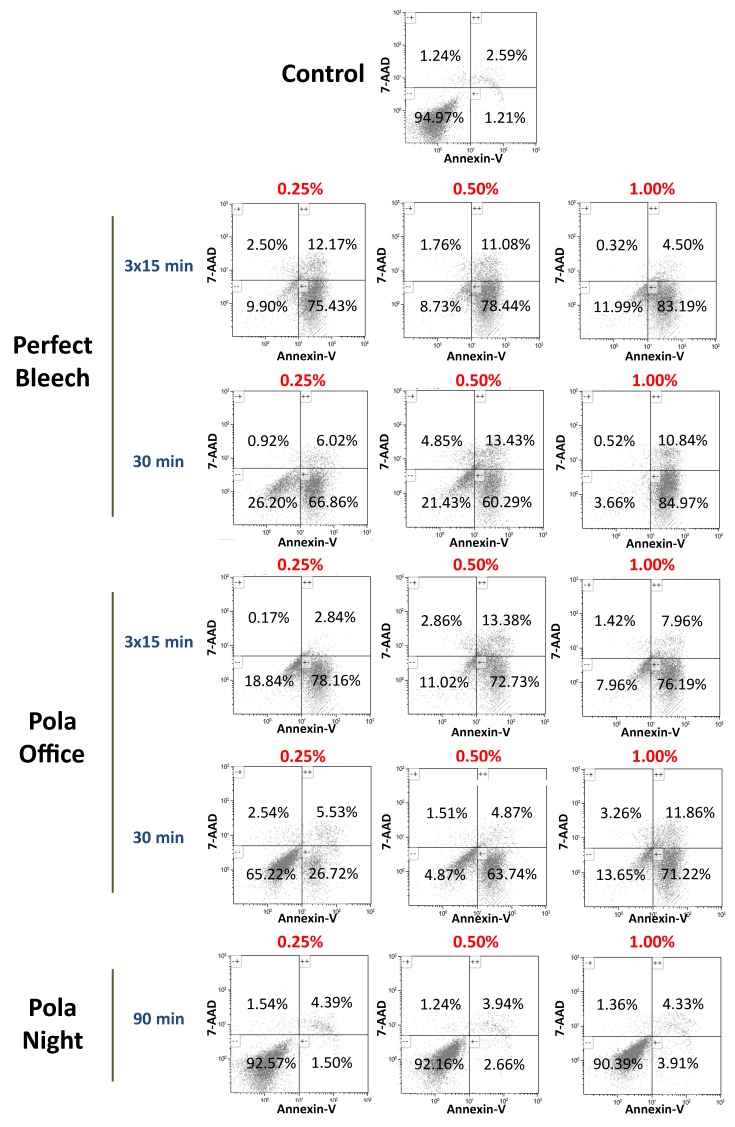
Figure 7.
hDPSCs were cultured with bleaching extracts and plastic (control) for 72 h, before being labelled with Annexin-V and 7-AAD and analysed using flow cytometry. Numbers within the different quadrants represent the percentages of live (Annexin-V−/7-AAD−), early apoptotic (Annexin-V+/7-AAD−) or late apoptotic and necrotic (Annexin-V+/7-AAD+ and Annexin-V−/7-AAD+) cells. Dot-plots display representative flow cytometry results from three independent experiments. comma in the figure should be decimal point.

