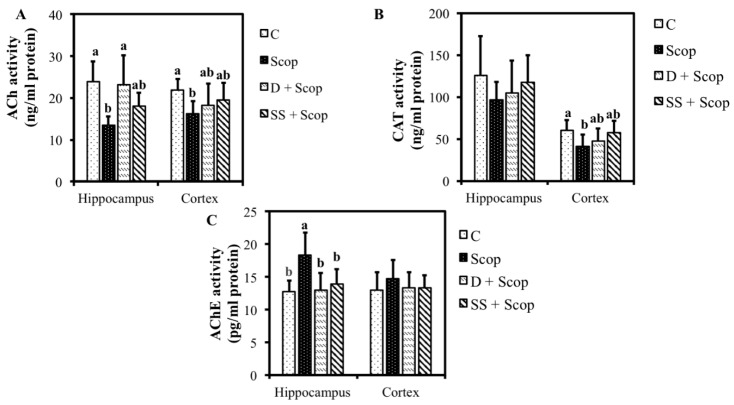
Figure 5.
Effect of Stachys sieboldii in hippocampus and frontal cortex of animal brain Acetylcholine (A) Choline acetyl transferase, (B) and Acetylcholine esterase level (C). All values are mean ± SD (n = 10). Mean with different superscripts in the same row such as a, b indicates significant difference by ANOVA with Tukey’s test at p < 0.05 compared to control group.

