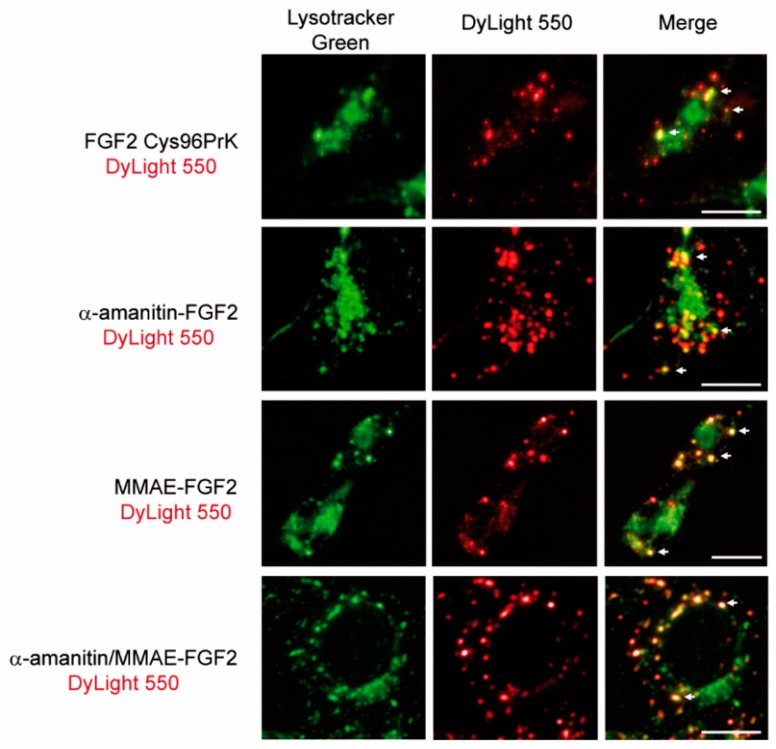
Figure 4.
Representative images of specific colocalization of FGF2 conjugates with lysosomes. Conjugates were labeled with DyLight550 (red) and lysosomal structures were visualized with the use of Lysotracker Green (green). White arrows indicate selected regions of co-localization. Scale bars represent 20 µm.

