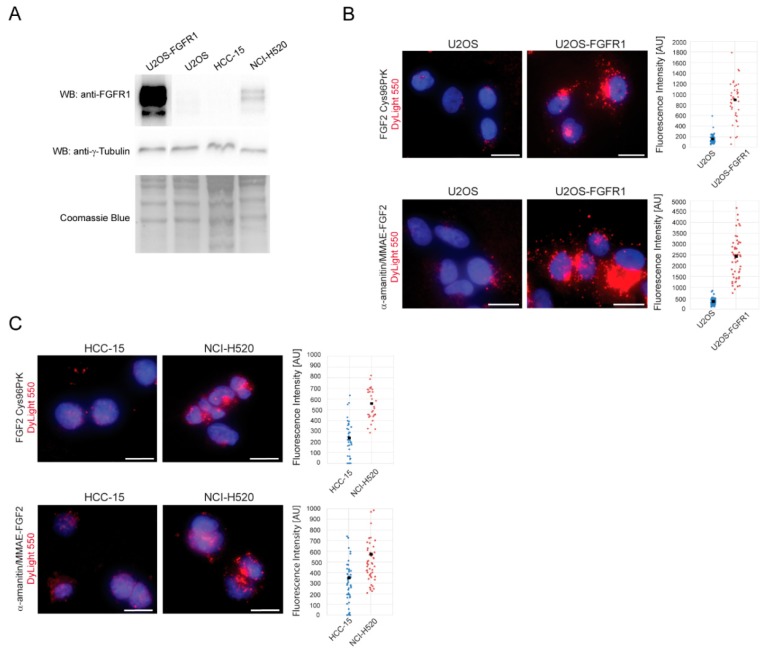
Figure 5.
Quantitative analysis of FGF2 dual conjugate internalization into FGFR1-positive and FGFR1-negative cancer cell lines. (A) Western blot analysis of FGFR1 expression levels in tested cell lines. Coomassie staining was used as a loading control; (B) Osteosarcoma cells (U2OS) (FGFR1-negative) and U2OS-FGFR1 (FGFR1-positive) cells were treated with FGF2 dual warhead conjugate labeled with DyLight550 and intensity of fluorescence within single cells was measured and plotted. Black spots represent average fluorescence intensity (C) An analogous experiment was performed on squamous cell lung carcinoma HCC-15 (FGFR1-negative) and NCI H520 (FGFR1-positive). For both models, FGFR1-expressing cell lines (U2OS-FGFR1 and NCI H520) showed efficient internalization. Scale bars represent 20 µm.

