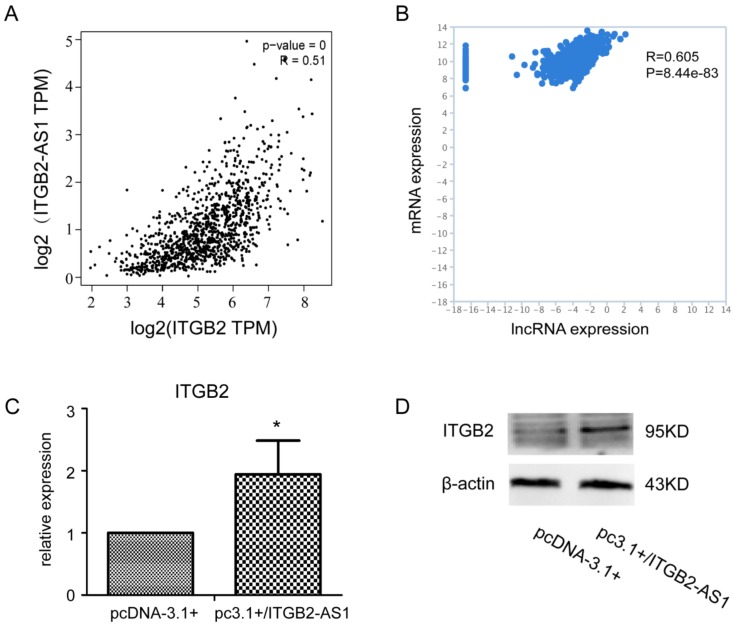
Figure 4.
There is a positive correlation between the expression of ITGB2-AS1 and ITGB2. (A) The correlation between ITGB2-AS1 and ITGB2 in GEPIA website; (B) The correlation between ITGB2-AS1 and ITGB2 in TANRIC website; (C) Q-PCR assay in MCF-7 cell; the β-actin was used as internal reference; (D) The ITGB2 protein expression was determined by western blotting in MCF-7 cell. * p < 0.05 vs. control group.

