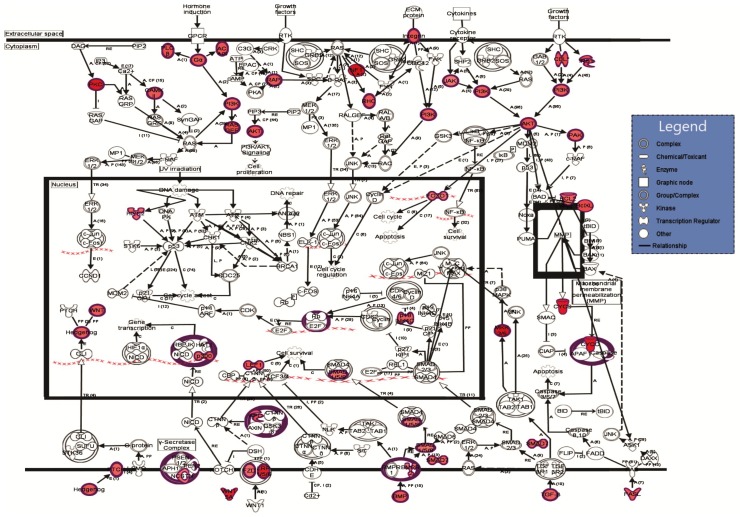
Figure 3.
The predicted molecular connections between the differentially regulated genes in the extracellular space, cytoplasm, and nucleus of IPEC-1 cells under the LB mixture action. Information about the regulation of genes is included in the figure: the red color gradient from dark to light shows the degree of genes up-regulated in lactobacilli treated IPEC cells versus control cells. Nodes were used to connect the regulated genes; grey lines show inconsistent or no predicted effects; ( ) = direct relationship; (
 ) = inhibition; n = 4.

