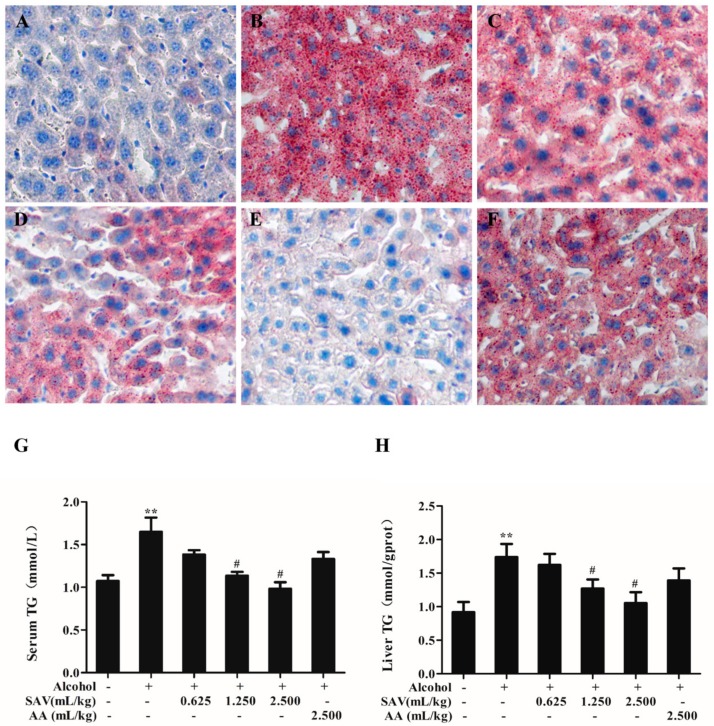
Figure 2.
Effect of SAV on alcohol-induced hepatic steatosis. Liver sections were stained with Oil Red O and examined by light microscopy (200× magnification) in Control group (A); Ethanol group (B); Ethanol + SAV (0.625 mL/kg b.w.) group (C); Ethanol + SAV (1.250 mL/kg b.w.) group (D); Ethanol + SAV (2.500 mL/kg b.w.) group (E) and Ethanol + AA group (F); Serum level of TG (G) and hepatic level of TG (H) were detected with microplate reader. All data are expressed as mean ± SEM (n = 5–7). ** p < 0.01 versus control group versus control group, # p < 0.05 versus ethanol group.

