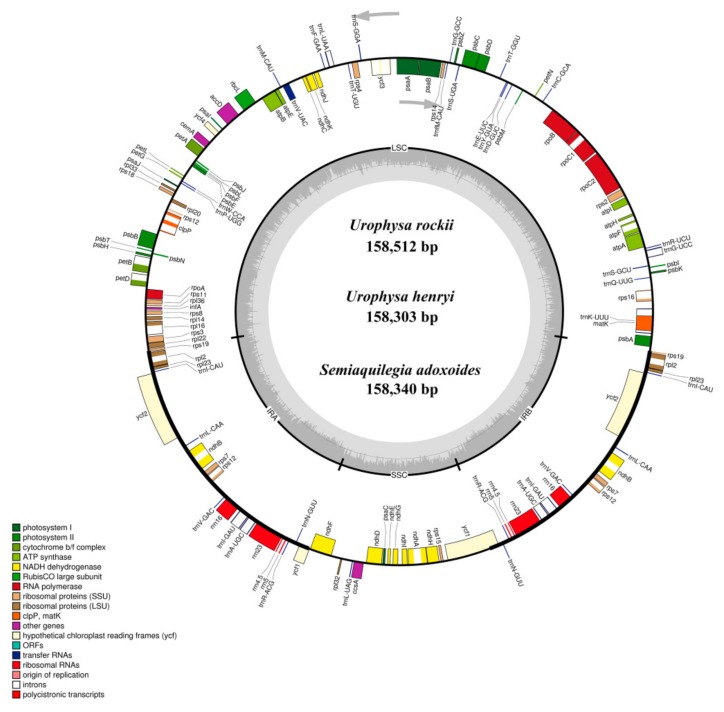
Figure 1.
Gene maps of the Urophysa rockii, Urophysa henryi and Semiquilegia adoxoides chloroplast (cp) genomes. Genes shown inside the circle are transcribed clockwise, and those outside are transcribed counterclockwise. Genes belonging to different functional groups are color-coded. The darker gray color in the inner circle corresponds to the GC content, and the lighter gray color corresponds to the AT content. SSU: small subunit; LSU: large subunit; ORF: open reading frame.

