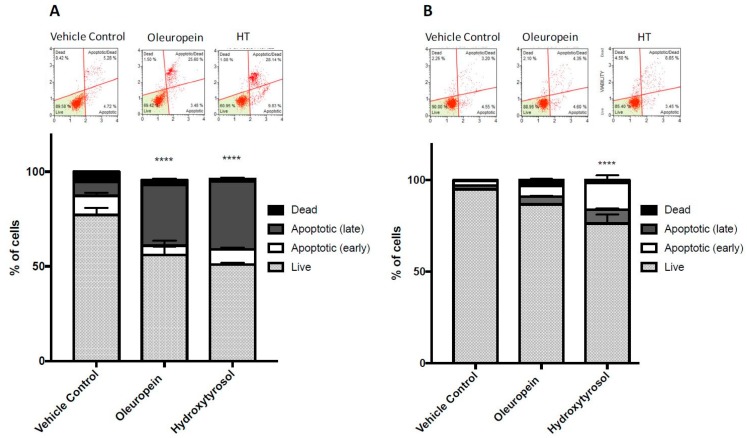
Figure 4.
Induction of caspase 3/7-dependent apoptosis of MIA PaCa-2 (A) and HPDE (B) cells treated with oleuropein (200 µM) and hydroxytyrosol (100 µM) for 48 h. Bar graphs show the percentage of live, early apoptotic, late apoptotic and dead cells determined by analysis of the activation of caspase 3/7. Ordinary two-way ANOVA and Tukey’s multiple comparisons test compare total apoptotic cells in treated cells (oleuropein or hydroxytyrosol) to vehicle control. **** p < 0.0001.

