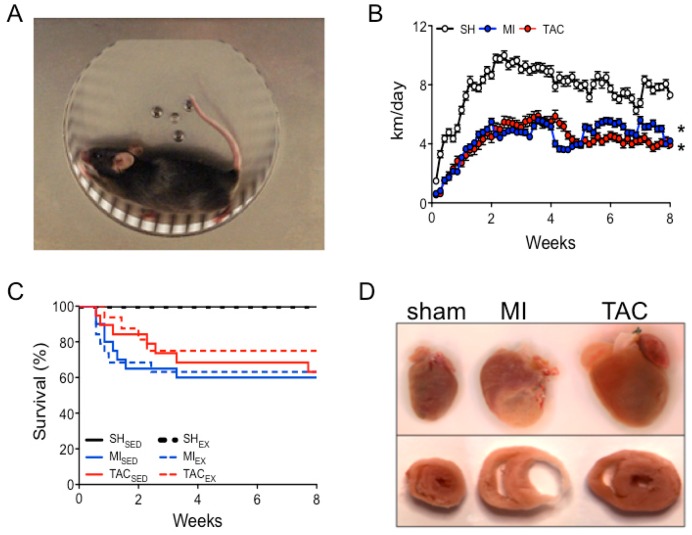
Figure 1.
Experimental models, daily running distance, and survival. (A) Voluntary wheel running; (B) daily running distance of sham (SH), myocardial infarction (MI), and transverse aortic constriction (TAC) mice; (C) Kaplan–Meier survival curve for all groups; (D) post-mortem examples of hearts and cardiac cross sections of sham mice and mice with an MI or TAC. Total number of animals entering the study in voluntary running (EX) and sedentary housing (SED) groups: SHSED (n = 12), SHEX (n = 22), MISED (n = 21), MIEX (n = 19), TACSED (n = 19), and TACEX (n = 16). * p < 0.05 total running distance vs. total running distance of sham mice.

