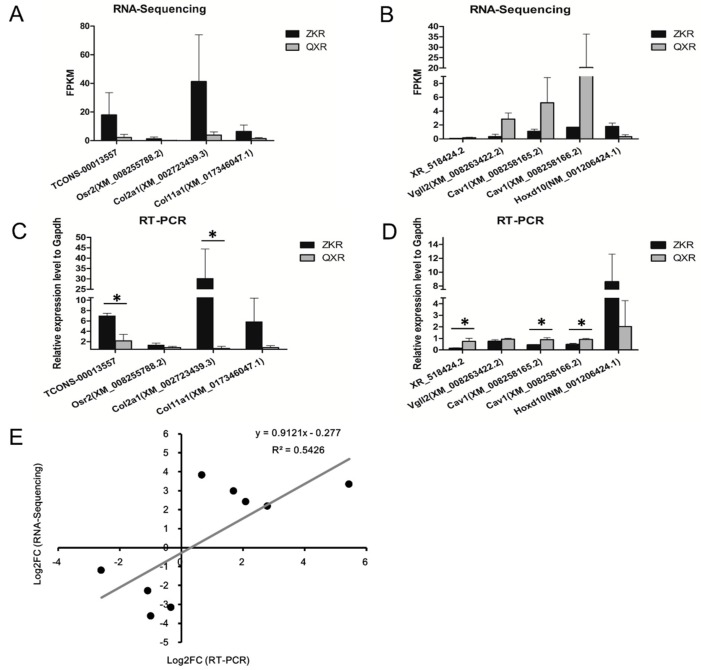
Figure 6.
The expression levels of lncRNAs TCONS_00013557 and XR_518424.2 and the corresponding co-expression mRNAs by transcriptome sequencing and RT-PCR. The expression levels of lncRNA TCONS_00013557 and its co-expressed mRNAs (Osr2, Col2a1, and Col11a1) at the stage of S1 by RNA-Sequencing (A) and RT-PCR (C). The expression levels of XR_518424.2 and its co-expressed mRNAs (Vgll2, Cav1, and Hoxd10) at the stage of S2 by RNA-Sequencing (B) and RT-PCR (D). (E) Linear regression analysis of fold change (FC) data between RT-PCR and RNA-Sequencing. ZKR: ZIKA rabbits; QXR: Qixin rabbits; S1, S2, and S3 refer to the age of 0 day, 35 days, and 84 days after birth, respectively. * refers to the statistically significant difference (p < 0.05). Black dots represent log2 transformed FC values of a gene obtained from RT-PCR (X-axis) and RNA-Sequencing (Y-axis). R: correlation coefficient.

