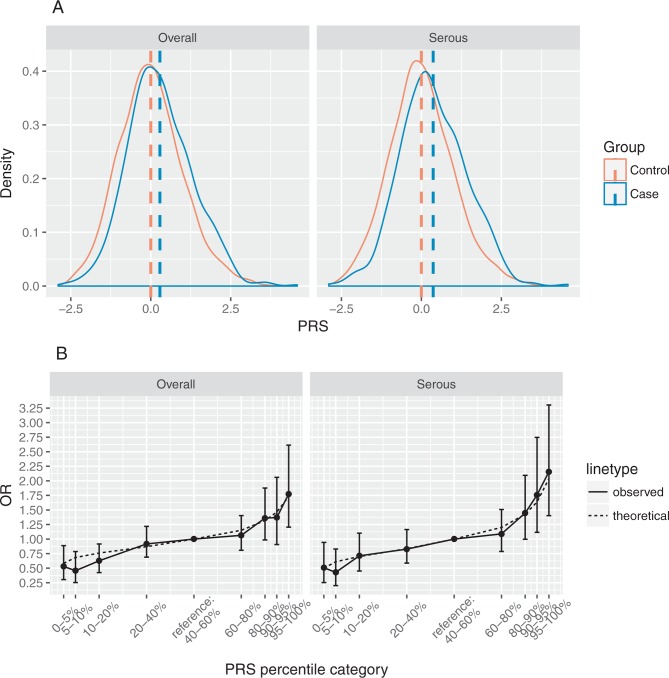
Figure 2.
(A) Distribution of the standardised overall and serous polygenic risk scores (PRSs) in overall and serous ovarian cancer cases and controls. The dashed vertical lines show the PRS means. (B) OR estimates between overall/serous PRS percentiles and overall/serous ovarian cancer risk relative to the middle PRS quintile (40%–60%). The solid line shows the estimated ORs with 95% CI, and the dashed line represents the theoretical OR values assuming multiplicative model.

