Figure 2.
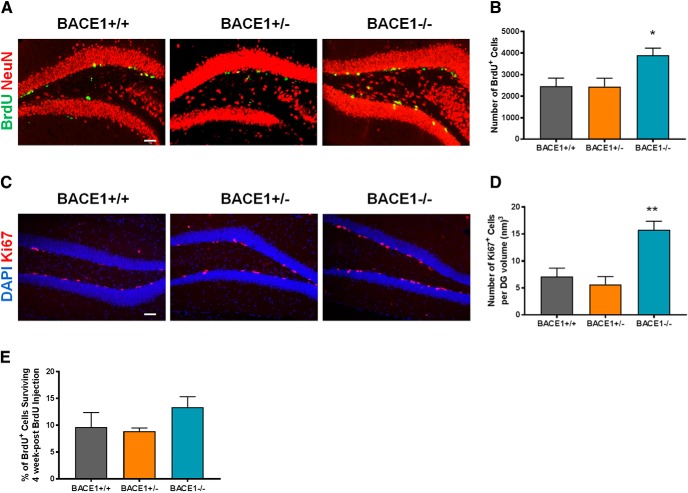
Loss of BACE1 increases NPC proliferation without affecting NPC survival. A, Photomicrographs of BrdU+ cells 1 d after BrdU injection in the DG of BACE1+/+, BACE1+/–, and BACE1–/– mice. Green or yellow, BrdU+ cells; red, NeuN+ cells. Scale bar: 50 µm. B, Quantification of BrdU+ cells 1 d post-BrdU injection (mean ± SEM; n = 6 in BACE1+/+, 6 in BACE1+/–, and 5 in BACE1–/– mice; F(2,14) = 4.629, p = 0.0286); *, p < 0.05. C, Photomicrographs of Ki67+ cells in the DG of BACE1+/+, BACE1+/–, and BACE1–/– mice. Red, Ki67+ cells; blue, DAPI+ cells. Scale bar: 50 µm. D, Quantification of Ki67+ cells (mean ± SEM; n = 5 in each group; F(2,12) = 15.52, p = 0.0012); **, p < 0.01. E, To provide a measure of cell survival during the 4-week post-BrdU time period, the number of BrdU+ cells at the 4-week post-BrdU time point was expressed as a percentage of the number present at the 1-d post-BrdU time point (mean ± SEM; n = 6 in BACE1+/+, 8 in BACE1+/–, and 5 in BACE1–/– mice; F(2,16) = 1.654, p = 0.2224).

