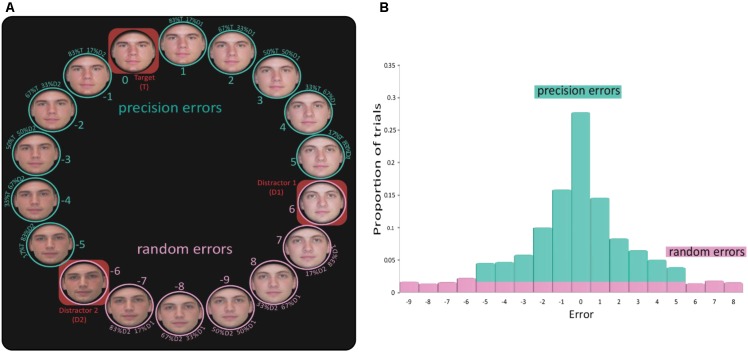
FIGURE 2.
Analysis technique. (A) The report circle comprised of 18 faces. The three original (un-morphed) faces are marked by red rectangular frames. In this example, face ‘0’ is the target face on which the participant is required to report, as this is the correct answer. Faces 6 and –6 are the other two original faces, and all the faces between them are linear morphs between the two original faces. When the subject selected a face that includes any resemblance to the target face (–5 to 5), this was treated as a precision error. Selection of a face that had no resemblance to the target face (errors above 5 and below –5) was treated as a random error. (B) An example of an error distribution of one participant in one condition. Precisions errors are marked in green and random errors in pink.

