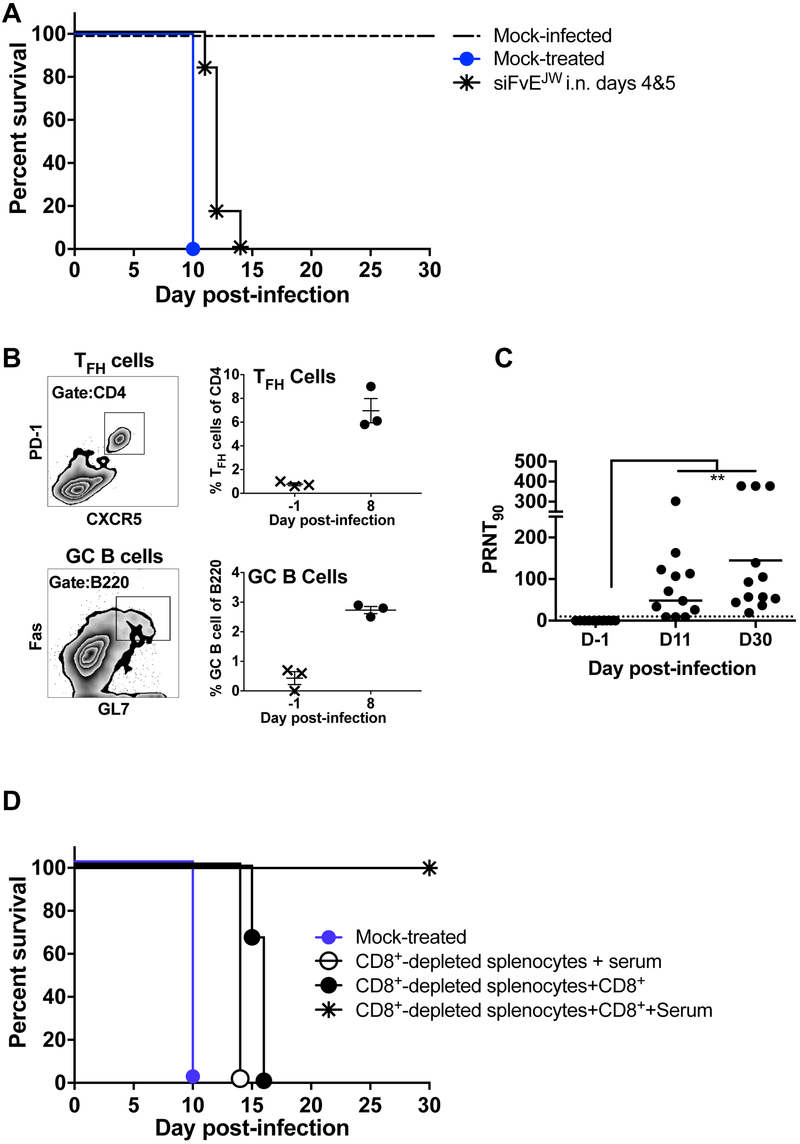
Figure 3. Immune responses mediate recovery in RVG9R-siFvEJW treated WNV-infected mice.
(A) Kaplan-Meier survival curves of immunodeficient NSG mice treated i.n. with RVG9R-siFvEJW on days 4 & 5 p.i. with 100LD50 WNV. n = 6 mice per group. (B) Flow cytometric detection of TFH (CD4+, PD1+ and CXCR5+) and GC B (B220+, Fas+ and GL7+) cells in spleens of RVG9R-siFvEJW treated C3H mice on day 8 p.i. Left- representative plots; Right- cumulative data. Each data point represents one mouse. Bars are geometric mean. (C) Serum PRNT90 of mice treated with RVG9R-siFvEJW at the indicated days p.i. with WNV. (D) Kaplan-Meier survival curves of C3H recipients that received splenocyte populations (w/w/o immune serum) at day 5 p.i. with WNV from donor RVG9R-siFvEJW treated mice that survived WNV challenge. n = 3-4 mice per group. See also Figure S3.

