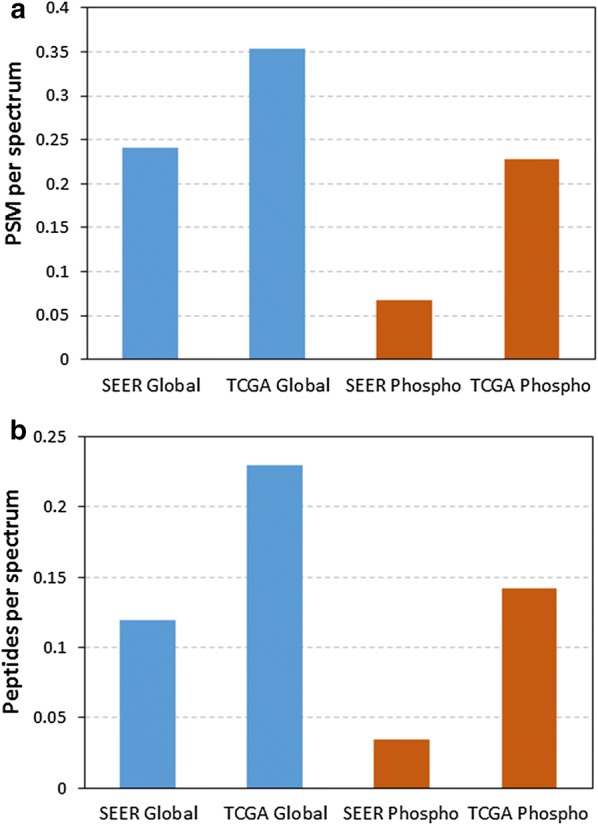
Fig. 2.

Comparison of FFPE (SEER) and OCT (TCGA) proteome coverage. The comparative analysis was done using both the spectrum identification rates (a) and unique peptide identification rates (b). The identification rate is calculated as the number of PSM passing a 1% FDR cutoff (a) or unique peptide sequences (b) divided by the total number of MS/MS spectra taken by the mass spectrometer. The difference in assignment of PSMs and peptides between the TMT-10 (SEER) and iTRAQ-4 (TCGA) labeled samples is also adjusted to account for the known differences as described above
