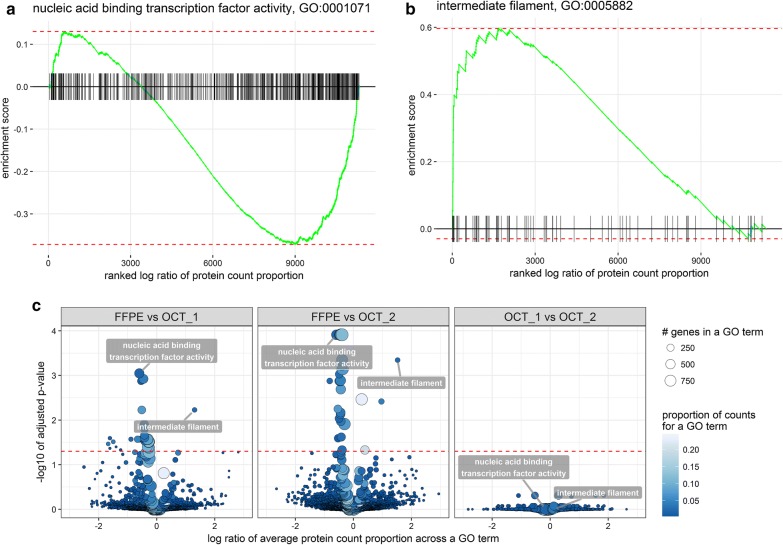
Fig. 5.
Comparison of GSEA enrichment in FFPE versus OCT samples. a and b are examples of the GSEA plots for the most depleted and enriched GO terms comparing FFPE to OCT. The significance of the test depends on the degree of concordance between changes in protein abundance within a GO term. Particular groupings of proteins at the low and high ends of the ranked list indicated non-random depletion and enrichment of the corresponding GO terms. The significance of the enrichment is based on one million permutations which were computed using FGSEA R package. c is the volcano plot reflecting significance and estimate fold of change of the GO term. The list of significantly affected GO terms is available in the Additional file 7: Table S6. The pattern and most significant GO terms remained consistent when FFPE was compared to OCT data, independent of the OCT analysis site (PNNL vs. JHU). Noteworthy, comparing two OCT datasets as negative control test set yielded no significantly different GO terms (right panel), thus demonstrating the validity of the statistical test

