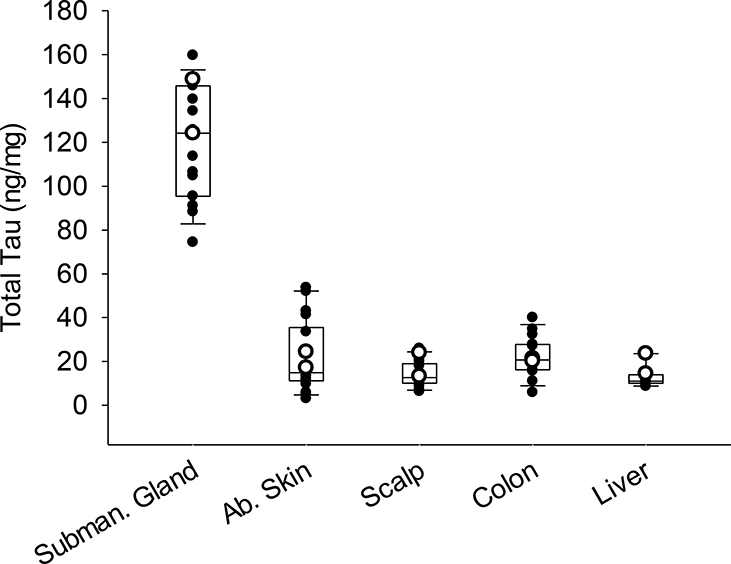
Figure 3.

Box and whisker plots with overlaying dot plots of ELISA measures of total tau in peripheral tissues of 18 cases (white dots = ND and black dots= AD cases). The bottom and top of the boxes represent the first and third quartiles, respectively; and the band inside the box is the median value. mg refers to mg of total protein.
