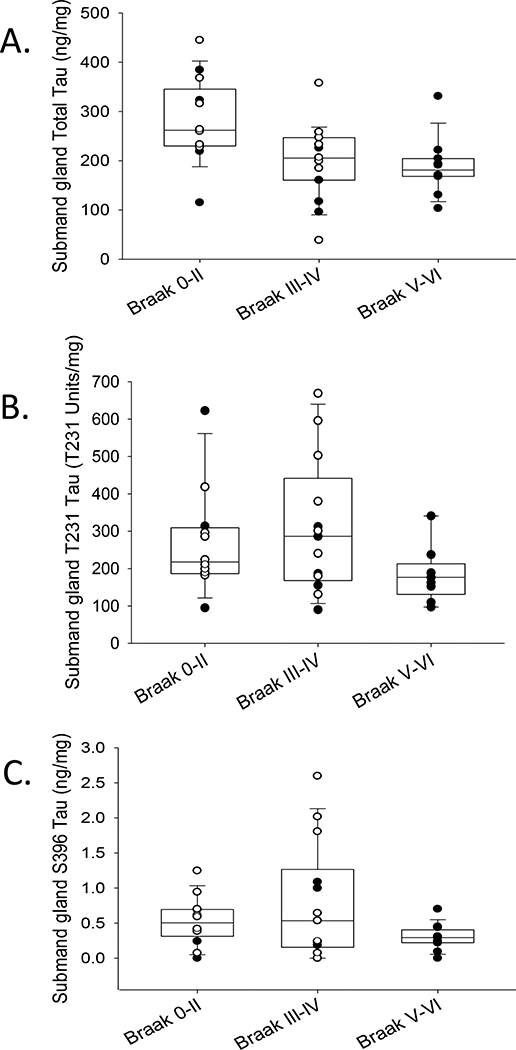
Figure 6.

Box and whisker plots with overlaying dot plots of ELISA measures of A) total, B) T231 and C) S396 tau species in submandibular glands across grouped Braak NFT stages (white dots = ND and black dots= AD cases). When adjusting for age, PMI, and gender there was a significant relationship with T231 (p=0.04) a marginal significant relationship with total tau levels (p=0.051) and no statistical significant relationships with S396 (p=0.162) with respect to grouped Braak NFT stage. mg refers to mg of total protein.
