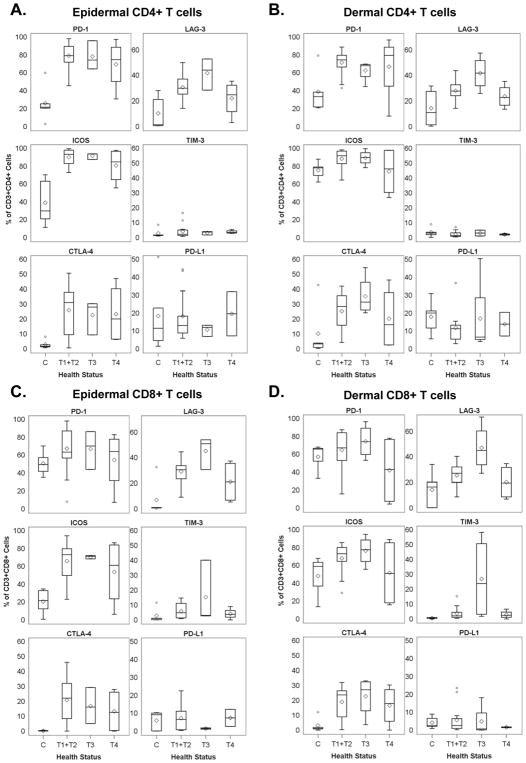
Figure 1. Immune checkpoint expression by CD3+CD4+ and CD3+CD8+ T cells.
(A) Percentage of CD3+CD4+ epidermal cells stained with the indicated immune checkpoint markers. (B) Percentage of CD3+CD4+ dermal cells stained with the indicated immune checkpoint markers. (C) Percentage of CD3+CD8+ epidermal cells stained with the indicated immune checkpoint markers. (D) Percentage of CD3+CD8+ dermal cells stained with the indicated immune checkpoint markers. C, controls; T1, patches/plaques < 10% of body surface area; T2, patches/plaques ≥ 10% of body surface area; T3, ≥ 1 skin tumor; and T4, erythroderma. Diamonds indicate the mean value; boxes span the 25th–75th percentile (inter-quartile range, IQR); whiskers indicate the highest/lowest data point within 1.5 * IQR from the box. Any remaining data points are shown as circles. The Kruskal Wallis test determined the indicated P values, which compare healthy control skin vs all tumor stages combined. There were too few samples from patients with T3 or T4 disease to discern true differences between tumor stages. See also Table 2. Representative data from 3 independent experiments are shown.

