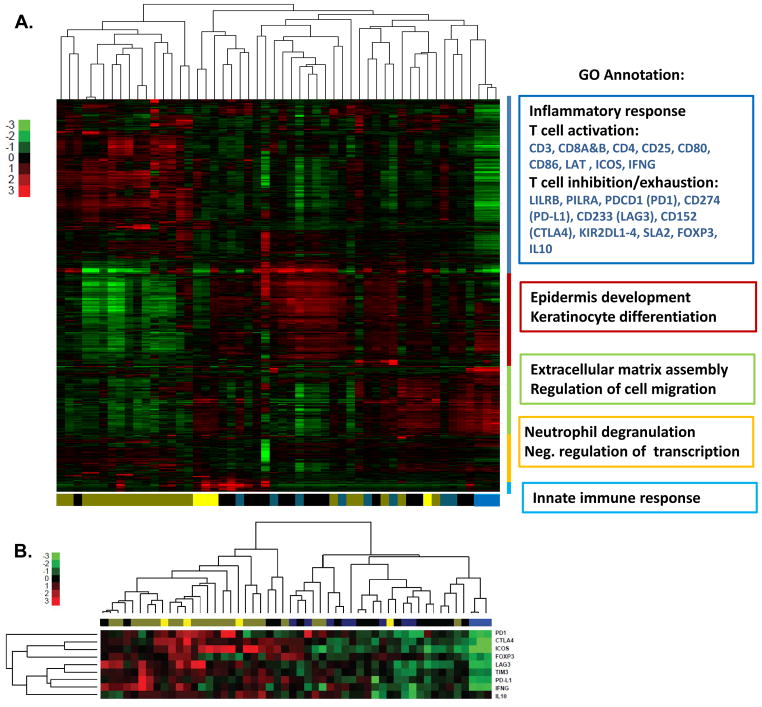
Figure 3. Unsupervised clustering heat map of genome-wide mRNA expression profiles, using skin samples from 49 MF/SS patients and 3 healthy individuals.
(A). The unsupervised hierarchical clustering analysis identified a distinctive mRNA expression pattern for early stage MF (T1/T2) compared with advanced stage MF/SS (T3/T4) samples, and both groups are different from healthy skin. Data shown are log2 transformed expression values relative to the mean expression level across all samples of 6,418 genes (see Materials and Method for details). Genes in rows and samples in columns were both hierarchically clustered, while samples were color-coded by sample type. The following sample categories were assigned by color: healthy control (light blue), T1 stage (blue), T2 stage (black), T3 stage (ochre) and T4 stage (yellow). The gene ontology (GO) analysis identified five clusters. The GO annotation for each cluster of genes shows their related functions and were associated with 1) an immune/inflammatory response (T-cell activation and dysregulation/exhaustion) signature, 2) epidermis and keratinocyte development, 3) extracellular matrix and cell migration regulation, 4) neutrophil degranulation and negative regulation of transcription and 5) innate immune response. (B) To elucidate whether MF/SS display a distinctive exhaustion-related marker expression profile compared with healthy skin, we performed a supervised analysis following the previously mentioned criteria. Immune checkpoint and inflammatory gene expression profiling [PDCD1 (PD-1), CD274 (PD-L1), HAVCR2 (TIM3), CTLA4, LAG3, ICOS, IFNG, FOXP3 and IL10] was performed. Clustering analysis divided CTCL skin samples into 2 groups based on decreased/inactivated and increased/highly activated expression of gene sets associated with immune checkpoint inhibition. Advanced stages (T3/T4) displayed higher expression of immune checkpoint and inflammation genes than did T1/T2 stage patients or healthy controls. One independent experiment was performed with 45 CTCL patients and three healthy controls.

