Fig. 2.

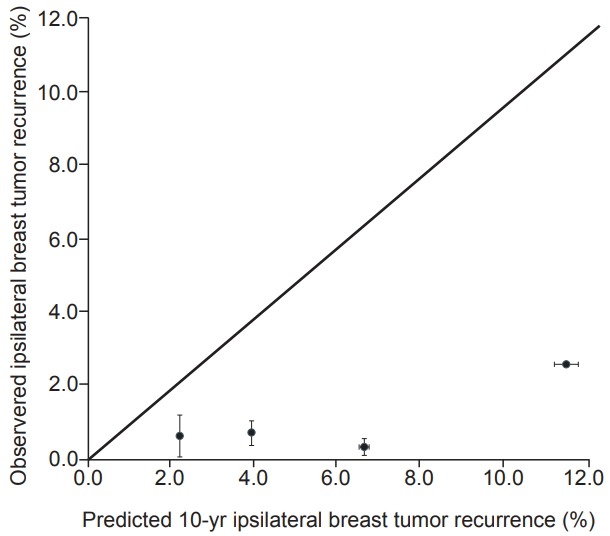
Calibration plot for IBTR! 2.0 nomogram. The nomogram predicted recurrence rate was plotted against the observed recurrence rate.

Calibration plot for IBTR! 2.0 nomogram. The nomogram predicted recurrence rate was plotted against the observed recurrence rate.