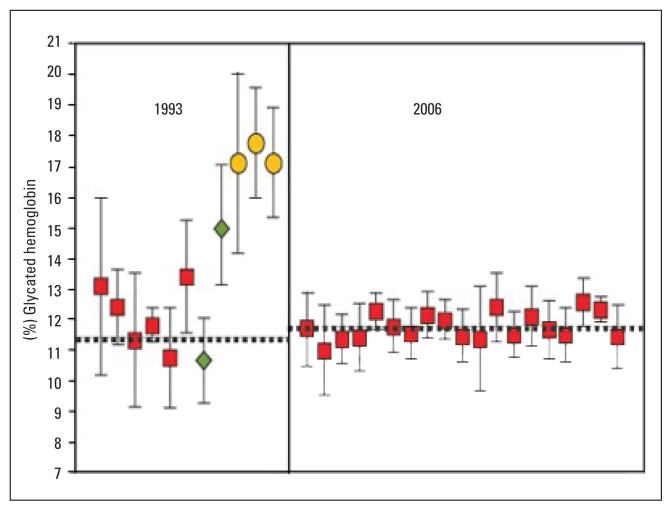
Figure 1.
Glycated hemoglobin results from the College of American Pathologists in 1993 and 2006.10 Each point and bar represent the mean ±2 standard deviation of results for a single method. Diamonds represent results reported as HbA1, squares represent results reported as HbA1c, and circles represent results reported as total GHb. The dotted horizontal line represents the NGSP/DCCT target value. (Reproduced with permission: From the IVD (In Vitro Devices) Technology in Los Angeles, CA, and the University Of Missouri School Of Medicine in Columbia, MO).

