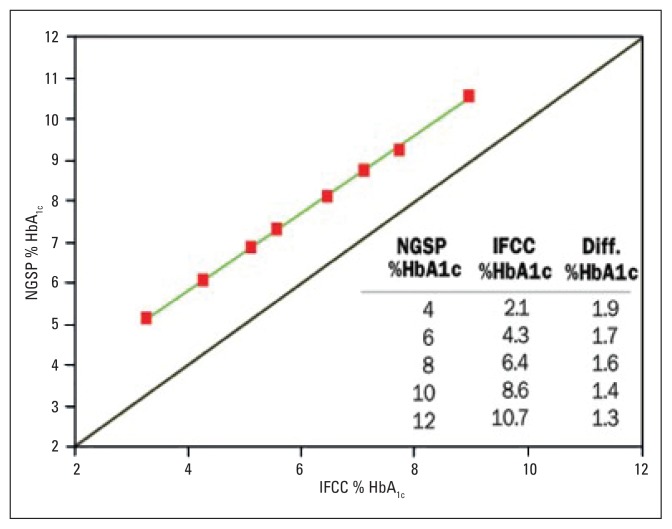
Figure 2.
The relationship between HbA1c measured by the NGSP and IFCC networks.10 The upper green line is the regression line. The solid line is y=x. (Reproduced with permission: From IVD (In Vitro Devices) Technology in Los Angeles, CA, and the University of Missouri School of Medicine in Columbia, MO).

