Figure 2.
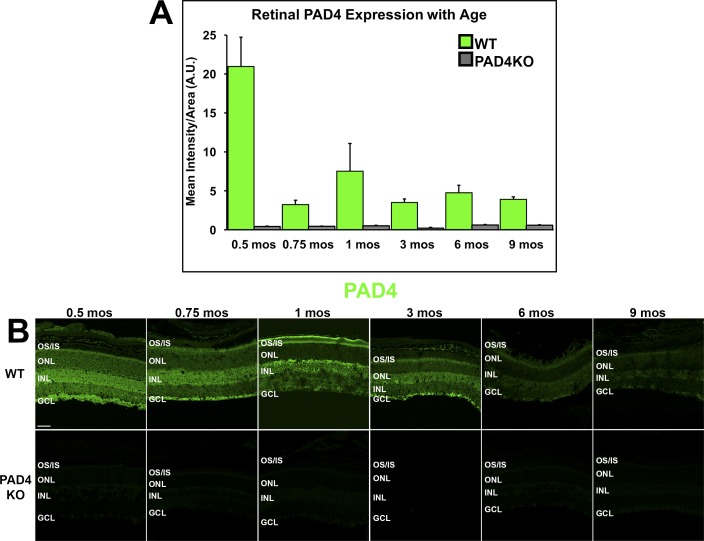
IHC analysis of PAD4 localization and expression levels in the mouse retina. (A) PAD4 expression levels were quantified using densitometric analysis of fluorescent intensities across the neural retina using ImageJ and plotted as mean intensity divided by area as a function of age. Data are expressed as the mean ± SEM (error bars, n = 3). A steep decline in immunoreactivity was seen in WT mice between 0.5 and 0.75 months (14 vs. 21 days) of age, with subsequent peaks at 1 month and between 3 and 6 months. (B) Immunolabeling of PAD4 (green) in WT and PAD4KO mouse retinas at serial time points. GCL, ganglion cell layer; INL, inner nuclear layer; ONL, outer nuclear layer; OS/IS, photoreceptor outer segments/inner segments. Scale bar: 50 μm.

