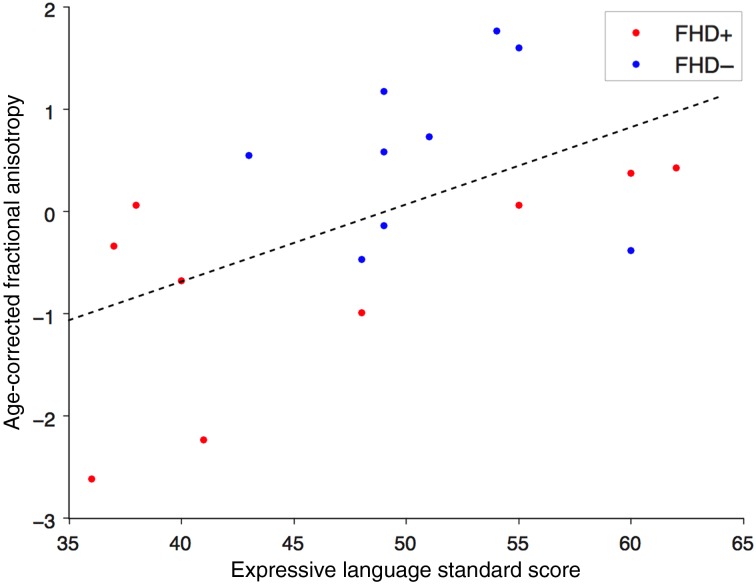
Figure 1.
Relationship between FA and expressive language. Scatterplot depicts the correlation between the age-corrected FA values of the left AF and the standard scores of the Expressive Language subtest of the MSEL. The red dots represent infants with a familial risk for dyslexia and the blue dots represent infants with no familial risk.

