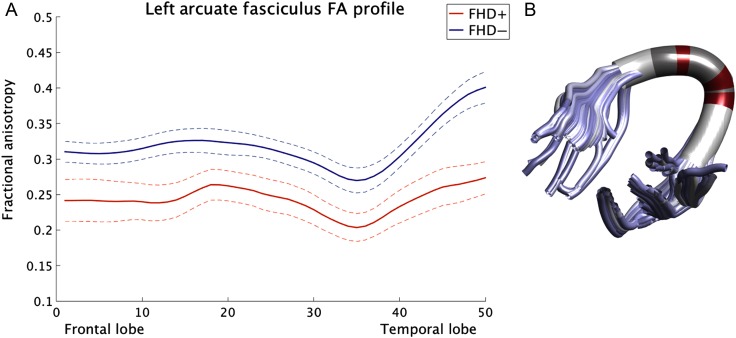
Figure 3.
Fractional anisotropy differences between infants with (FHD+) and without (FHD−) a familial risk for DD. (A) Tract profile of the left AF depicting FA values in FHD+ and FHD− infants at each of the 50 nodes. To illustrate the commonly reported dip in FA in the arc of the AF, we displayed the age-uncorrected FA values along the tract. However, the results for the age-corrected FA group differences look equivalent. The solid line represents the mean FA and the dashed line denotes one standard deviation. (B) Regions in which FHD+ infants exhibit significantly lower FA than FHD− infants are marked in red, and regions in which there are no significant differences between groups are marked in dark gray. Regions colored in white were not included in this specific analysis due to insignificant overlap between the infants (see also Supplementary Fig. 1).

