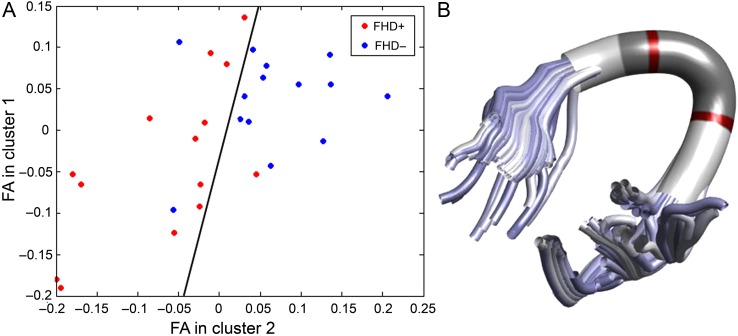
Figure 4.
Multivariate pattern classification of infants with (FHD+) and without (FHD−) a familial risk for DD using a linear support vector machine. (A) Classification is based on the FA values along the left AF and identifies a decision boundary (shown as a black line) that maximizes the margin to the nearest training cases of either class between 2 predictive FA clusters. The FA values are age-corrected and z-transformed. The red dots represent the FHD+ infants and the blue dots represent the FHD− infants. In (B), the 2 predictive segment clusters depicted in (A) are plotted in red.

