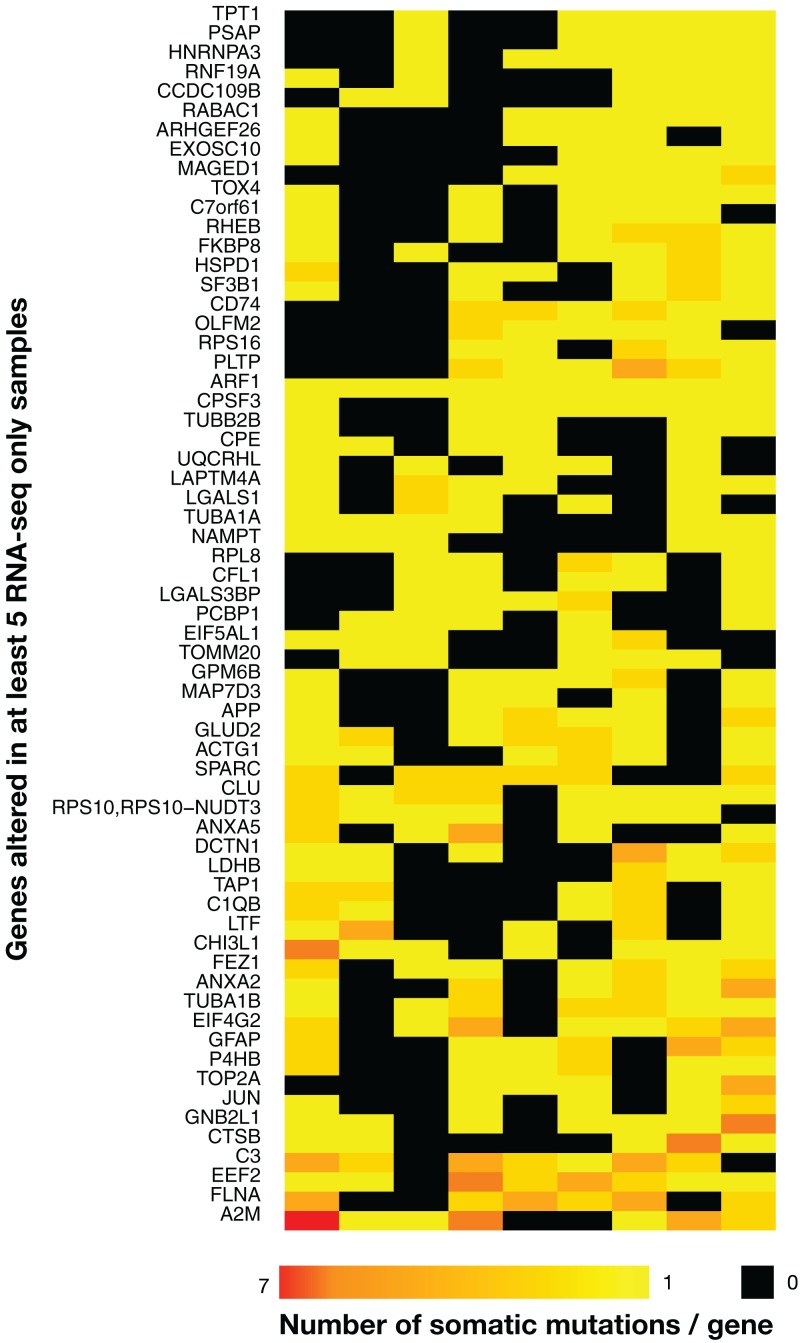
Figure 4. Heatmap of the 63 most widely mutated genes across TCGA samples in RNA-seq-only.
Only genes altered in coding regions in at least five out of nine tumor samples are shown. Rows indicate genes and columns are tumors. Black indicates no variants, bright yellow only one variant/gene and red seven variants/gene, with a gradient from yellow to red indicating a number of variants/gene included between one and seven. The heatmap was clustered by rows and columns (the dendrogram is not shown).

