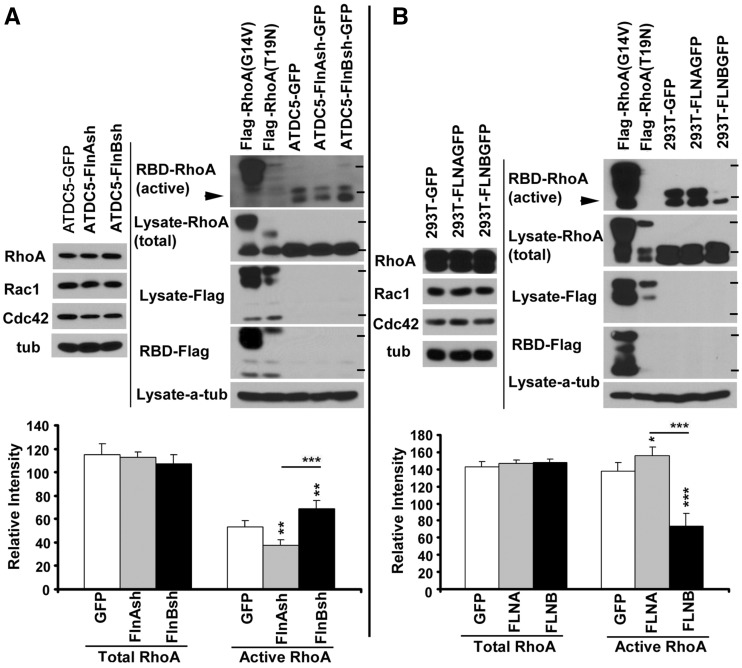
Figure 5.
FlnA and FlnB differentially regulate RhoA activation. (A) Western blot analyses of total and activated RhoA following inhibition of FlnA/B. Prolonged loss of FlnA in stably transfected ATDC5 chondrocytes induces down-regulation of active RhoA levels (black arrowheads), while loss of FlnB induces up-regulation of active RhoA levels. Constitutively Flag-tagged active (RhoA G14V) and inactive (T19N) RhoA serve as controls. RhoA activity is assessed by pulldown using RBD (Rho binding domain), which interacts with RhoA-GTP. Following pulldown, blots are probed using RhoA antibody (or Flag antibody for the active/inactive RhoA) to assess activation levels. At times, two bands for activated RhoA are observed due to electrophoretic mobility. (B) In converse fashion, overexpression of FLNA causes up-regulation of active RhoA levels, while over-expression of FLNB causes down-regulation of active RhoA levels. HEK 293T cells are transfected with FLNA/B. 72 h post transfection, cells are harvested and RhoA activation levels assessed by RBD pulldown and blotting for RhoA. The statistical significance of the respective samples relative to control is indicated by asterisks on top of each bar. Asterisk localized above the line indicates statistical significance between samples. Molecular weight markers correspond to 25 and 30 kD. **P < 0.01, ***P <0.001 for n ≥ 3 independent experiments per variable.

