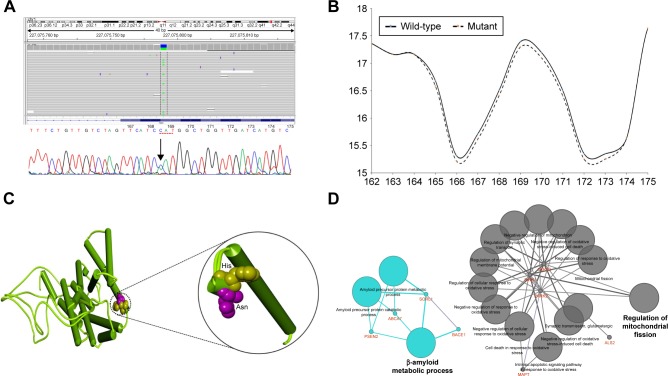
Figure 2.
Identification and in silico analysis of function the mutation in the patient.
Notes: (A) NGS and Sanger sequencing data identifying the PSEN2 H169N mutation in the proband. (B) Bulkiness profile of wild-type and H169N mutant PSEN2 proteins. Dotted line represents the shift in the bulkiness around the mutant site. X-axis represents amino acid sequence from N- to C-terminal. Y-axis represents scores computed by each algorithm. The prediction was done using the ProtScale program at Expasy server. (C) Differences of normal and mutant PSEN2 have been highlighted with a black circle, and histidine was labeled yellow, while asparagine was labeled pink. (D) ClueGO model on the putative pathways on proteins which carried mutations.
Abbreviations: NGS, next-generations sequencing; PSEN, presenilin.

