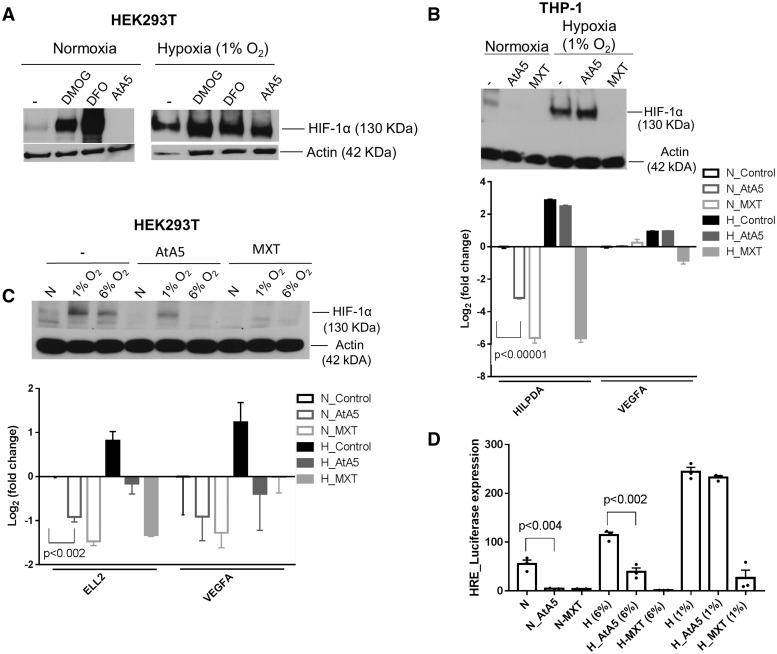
Figure 5.
AtA5 or MXT antagonizes HIF-1α and reduces hypoxic gene expression in transformed cell lines. (A) Immunoblot shows the expression of HIF-1α in lysates (40 µl) of 293T cells upon treatment with DMOG (1 mM), DFO (0.5 mM) and AtA5 (1 µM) when subjected to normoxia or hypoxia (1%) for 24 h. (B) Immunoblot shows the expression of HIF-1α in lysates (40 µl) of THP-1 cells upon treatment with AtA5 or MXT when subjected to normoxia or hypoxia (1%) for 24 h (upper panel). Bar graph depicts the fold change in gene expression of HILPDA and VEGFA under the same treatment conditions (n = 3 replicates) (lower panel) (C) Immunoblot shows the expression of HIF-1α in lysates (40 µl) of 293T cells upon treatment with AtA5 or MXT when subjected to normoxia or hypoxia (1 or 6%) for 24 h (upper panel). Bar graph depicts the fold change in gene expression of ELL2 and VEGFA in normoxia and hypoxia (1% O2) (n = 3 replicates) (lower panel) (D) Bar graph depicts the expression of the plasmid expressing luciferase under the control of hypoxia response element (HRE) when 293T cells are treated with AtA5 or MXT in normoxia or hypoxia (1 or 6% O2) for 24 h. (n = 3 replicates, mean and SEM shown).

