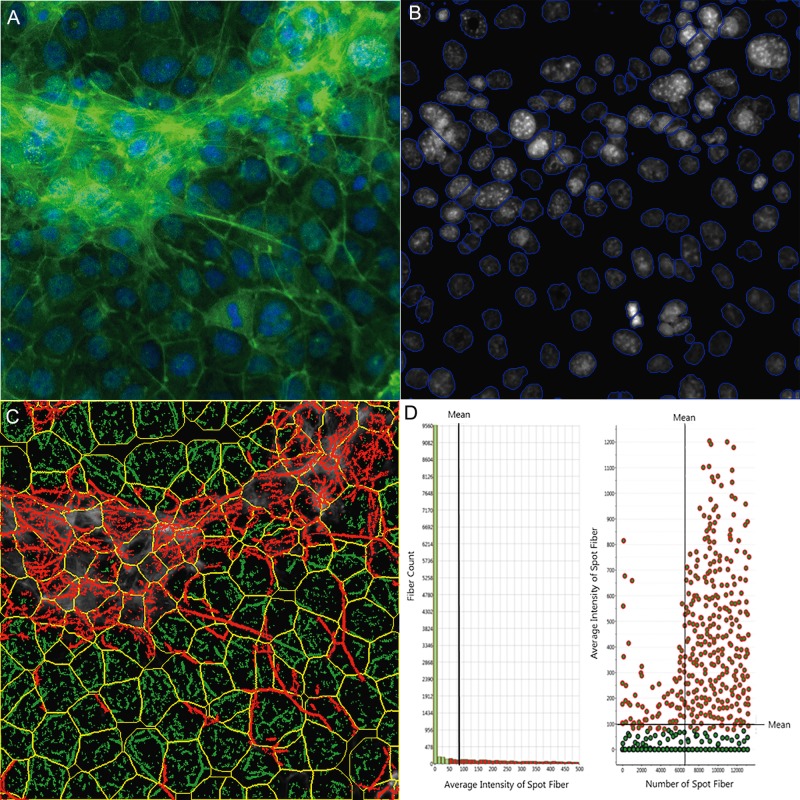
Figure 2.
Single-cell-based quantification of F-actin cytoskeletal structure. The multi-channel images were automatically captured using an Arrayscan VTI HCS reader with HCS Studio 2.0 Morphology Explorer BioApplication module (Thermo Fisher Scientific, Massachusetts). Cytoskeletal rearrangement analysis was conducted in the images obtained from the coculture model (A), and automatic segmentation of the nuclei images cells (blue line, B) and cellular outline (yellow line, C) were conducted. The localization and orientation of F-actin fibers were determined (C, green). A statistical summary of F-actin fibers was identified from bar charts and scatter plots (D). Actin fibers greater than a threshold length were identified and labeled with green, and the fiber intensity over 100 pixels were highlighted with red overlay (D), indicating F-actin bundle formation across cells in the coculture model.

