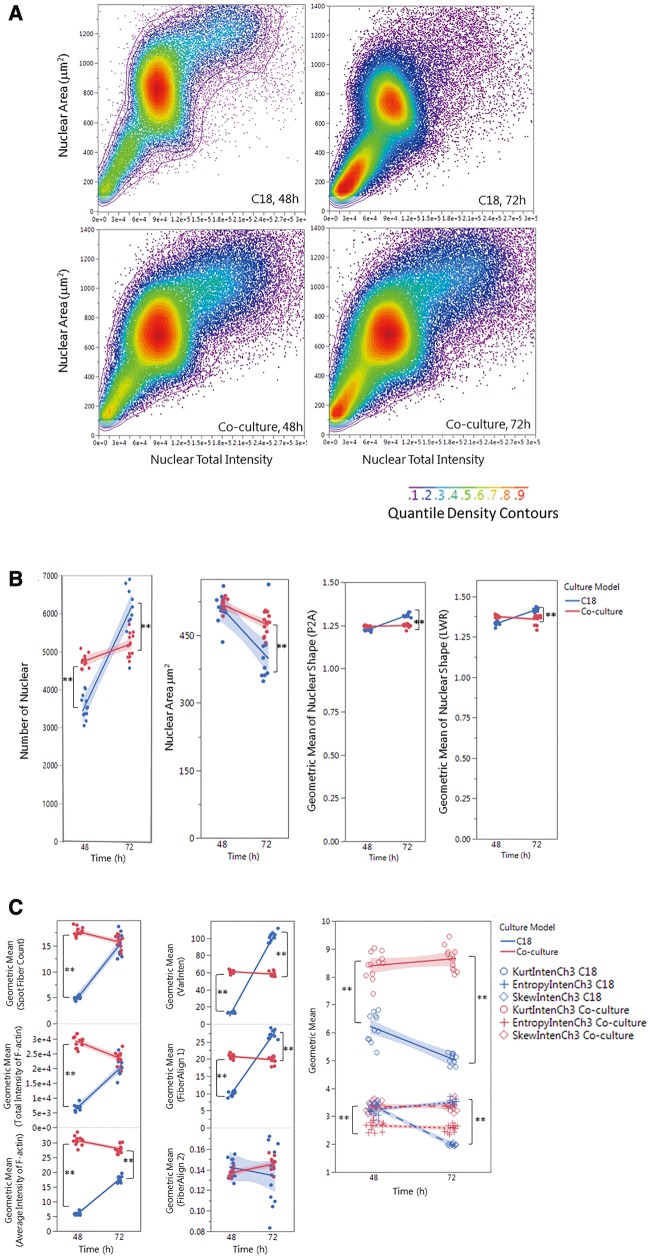
Figure 3.
Single-cell-based HCA of cell population (A), nuclear morphology (B) and F-actin cytoskeleton (C,D) in the testicular cell coculture model and single spermatogonia culture model. The single-cell-based analysis of the cell populations in the coculture as compared with the spermatogonial culture model is shown in panel A. The scatter plots of nuclear area versus nuclear total intensity at 48 or 72 h postinoculation denote the cell sub-populations, as shown in the color-code chart. Quantifications of nuclear morphology changes, including nuclear number, area, and shapes (P2A and LWR) are shown in panel (B). Quantifications of F-actin fiber distribution and variation of fiber intensity (the first-order texture) are shown in panel (C), including the geometric mean of F-actin Fiber count (Spot Fiber Count), average and total intensity of fibers, variability of the intensity distribution (VarInten), arrangement and alignment of the fibers inside the cell (FiberAlign1 and FiberAlign2), geometric means of kurtosis (KurtIntenCh3), Skewness (SkewIntenCh3), and entropy (EntropyIntenCh3). Quantifications of F-actin spatial arrangements (the second-order texture) are shown in panel (D). The second-order texture measures of F-actin reflected the spatial arrangements of the different pixels, including the maximum probability (MaxCoocIntenCh3), angular second moment (ASMCoocIntenCh3), entropy (EntropyCoocIntenCh3) and contrast (ContrastCoocIntenCh3). Data were presented as geometric mean of each well, and the linear line fit across the 2-time-point was conducted. Statistical analysis was conducted by one-way ANOVA followed by Tukey-Kramer multiple comparison (*p ≤ .05 and **p ≤ .001). The shaded area reflects the 95% CIs.

