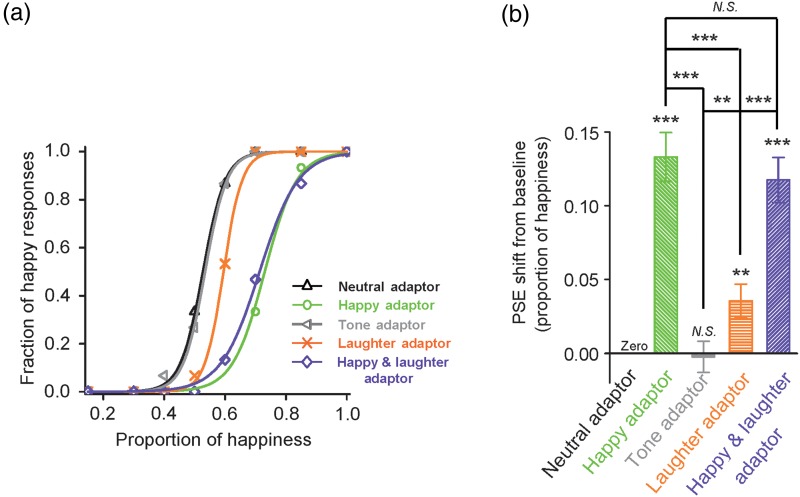
Figure 2.
Adaptation aftereffect on facial expression judgment. (a) The fraction of happy responses of a representative participant (ordinate) plotted as a function of the proportion of happiness of the test faces (abscissa), under the following conditions: Neutral Adaptor, adaptation to a neutral face (black); Happy Adaptor, adaptation to a happy face (green); Tone Adaptor, adaptation to a neutral tone (grey); Laughter Adaptor, adaptation to an auditory laughter (orange); Happy and Laughter Adaptor, adaptation to simultaneously presented happy face and laughter sound (violet). (b) Summary of data from all participants (n = 20). Average PSE relative to baseline condition (Neutral Adaptor) and SEM were plotted. *, **, *** and N.S. indicate significance levels P < 0.05, P < 0.01, P < 0.001, and no significance, respectively.

