FIG. 3.
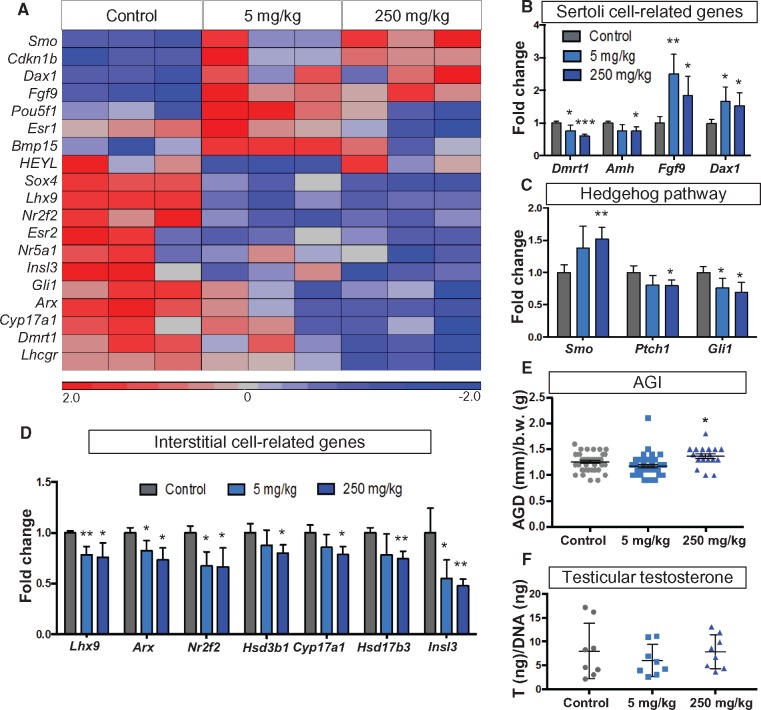
Testicular gene expression patterns and anogenital distance after DEHP exposure. A, A heatmap of the differentially expressed genes in the Nanostring assay, where mRNAs from E14.5 testes were analyzed. B, Expression of Sertoli cell-related genes. C, Expression of Hedgehog signaling genes. D, Expression of interstitial cell-specific genes. Both groups were compared with the control group and statistical analysis was conducted using Student’s t-test. * P < 0.05, ** P < 0.005. E, Anogenital Index [AGI: AGD (mm)/body weight (g)] of the male fetuses was measured at the age of E18.5. Statistical significance was analyzed using Dunnett’s test coupled with mixed effects analysis of variance to control for the litter effect. * P < 0.05. F, Testicular testosterone was measured using ELISA from E18.5 testes. Eight samples per group were chosen from different litters. The testosterone content of the testis (ng) was normalized to the DNA content (ng) of the testis lysate. Statistical significance was analyzed using one-way ANOVA followed by Dunnett’s test.

