Figure 1—
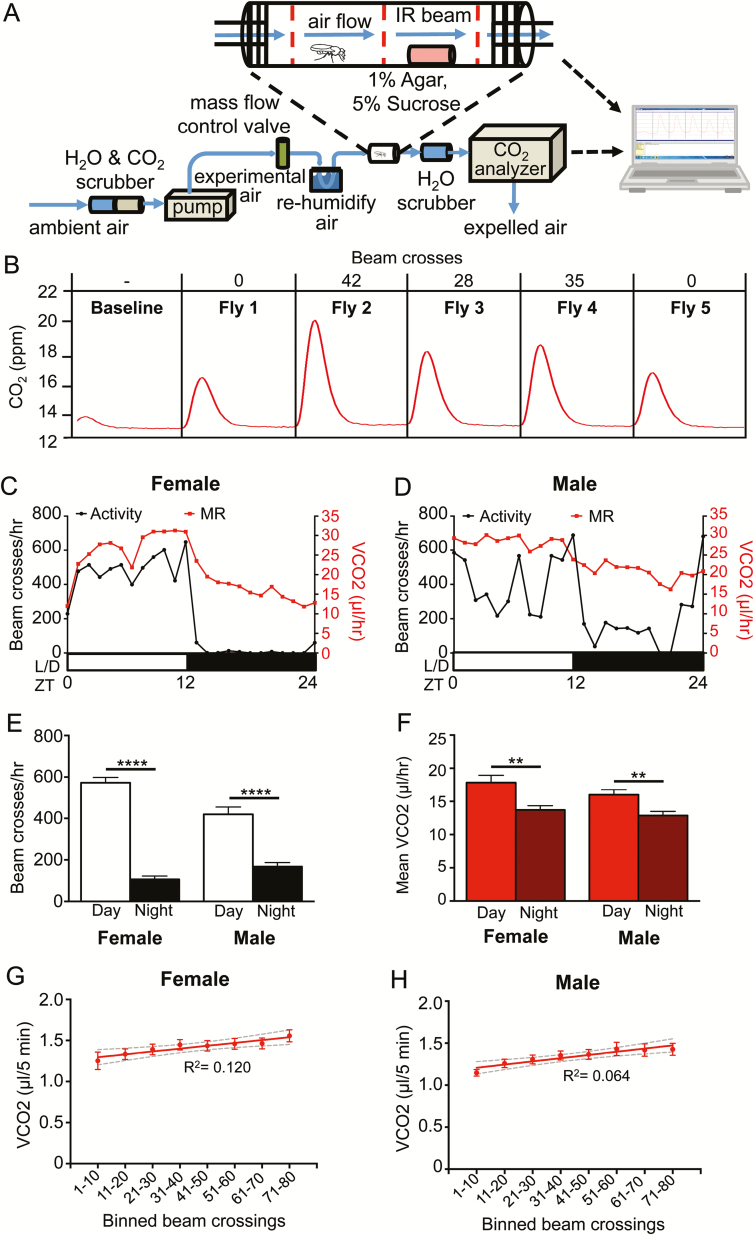
A system to measure MR in single flies. (A) MR was measured through indirect calorimetry. A stop-flow respirometry system measured the CO2 produced by single flies placed inside of a 70 mm long × 20 mm diameter glass tube. Each fly had access to 1% agar and 5% sucrose. Activity and sleep were measured simultaneously as MR using a Drosophila Locomotor Activity Monitor with three infrared beams running through each behavior chamber. The computer counted the number of beam breaks. (B) A representative 5-minute reading, with the activity in number of beam crosses and the amount of CO2 produced by each fly over time. (C) The MR and activity for one female fly. (D) The MR and activity for one male fly. (E) The activity of female (N = 24; p < .0001) and male (N = 35; p < .0001) flies in beam crosses per hour, over 12 hours of day and night (two-way ANOVA F(1,114) = 171.9, p < .0001). Condition-by-sex interaction is significant (two-way ANOVA F(1,114) = 15.30, p < .001). (F) The MR of female (N = 24; p < .01) and male (N = 35; p < .01) flies as CO2 produced per hour, over 12 hours of day and night (two-way ANOVA F(1,114) = 21.27, p < .0001). Condition-by-sex interaction is not significant (two-way ANOVA F(1,114) = 0.4137, p > .50). (G) Linear regression of absolute vCO2 readout versus activity of female flies (N = 24 each bin; R2 = 0.120) and (H) male flies (N = 35 each bin; R2 = 0.064). Gray dashed lines indicate 95% confidence interval. One-way ANOVA comparing the vCO2 at the 1–10 beam crossings bin to each subsequent beam crossing bin: females >60 crossings (N = 24 each bin; p < .05) and males >60 crossings (N = 35 each bin; p < .05). ANOVA = analysis of variance; IR = infrared.

