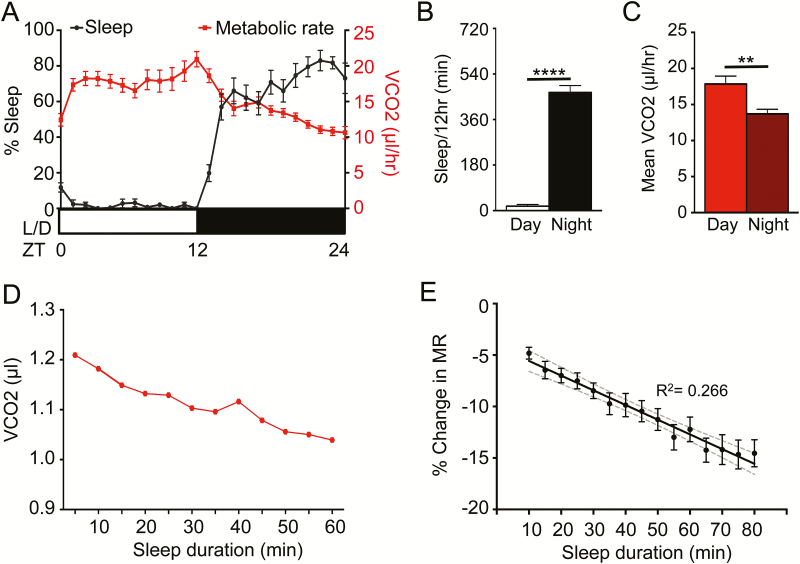
Figure 2—
MR is reduced during sleep state. Female control flies (w1118) were allowed to acclimate in the system for 24 hours. (A) MR shows an inverse pattern to their sleep (N = 24). (B) Total minutes of sleep per 12 hours of day and night for B (N = 24; p < .001). (C) The MR of female flies as CO2 produced per hour, over 24 hours of day and night (N = 24; p < .002). (D) The MR throughout a single, representative sleep bout during the night. (E) Linear regression model comparing percent change in MR versus sleep duration, binned per 5 minutes (N = 24; R2 = 0.266). Gray dashed lines indicate 95% confidence interval. One-way ANOVA comparing the initial percent change in MR at the 10-minute sleep bin to each subsequent sleep bin reveals significant differences after 35 minutes asleep (N = 24 each sleep bin; p < .05). ANOVA = analysis of variance.

