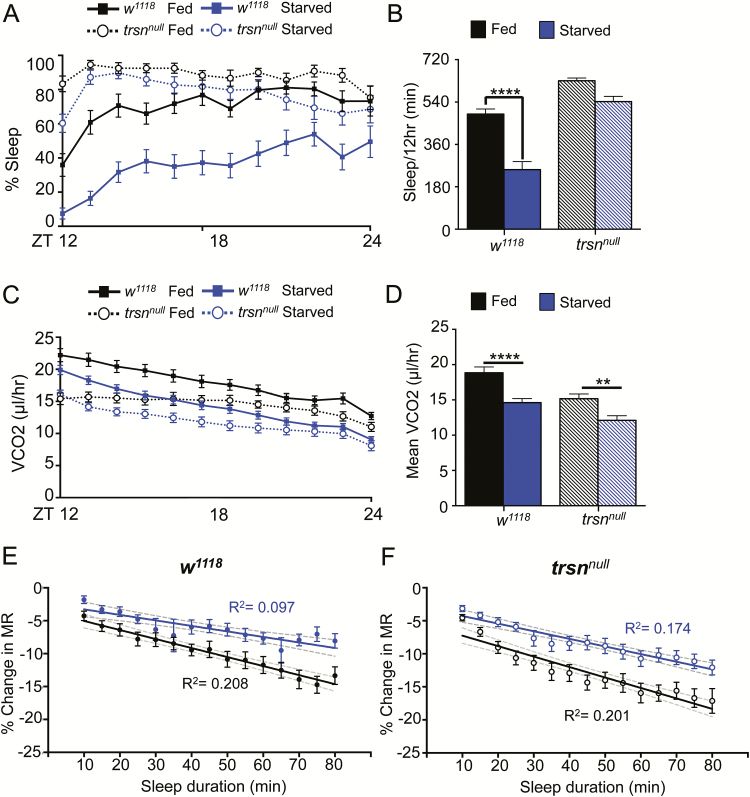
Figure 6—
Sleep-dependent changes in metabolism are intact in trsnnull flies. (A) Sleep did not significantly differ between trsnnull flies housed on sucrose or starved on agar alone. (B) Quantification of total nighttime sleep (ZT12-ZT24) revealed sleep is significantly lower in w1118 control flies (N = 30) housed on agar compared to fed (N = 28; p < .0001), while there is no significant difference between trsnnull flies (N = 28) housed on 5% sucrose or agar alone (N = 25; p > .05; two-way ANOVA F(1,107) = 42.52, p < .0001). Treatment-by-genotype interaction is significant (two-way ANOVA F(1,107) = 11.24), p < .01). (C) MR is lower in control and trsnnull flies housed on agar compared to flies housed on 5% sucrose. (D) Quantification revealed MR is lower in both starved trsnnull flies and controls (w1118, p < .0001; trsnnull, p < .01; two-way ANOVA F(1,107) = 28.22, p < .0001). There is no effect of treatment-by-genotype interaction (two-way ANOVA F(1,107) = 0.7162, p > .30). (E) Applied linear regression model comparing percent change in MR versus sleep duration, binned per 5 minutes reveals a correlation in w1118 fed flies (N = 28; R2 = 0.208), but only a weak effect in w1118 starved flies (N = 25, 5 flies did not sleep on agar; R2 = 0.097). Gray dashed lines indicate 95% confidence interval of each line. Comparison of the regression lines indicate that the slopes are different between the w1118 fed versus starved state (F = 7.09725, p< .01). One-way ANOVA comparing the initial percent change in MR at the 10-minute sleep bin to each subsequent sleep bin within each group reveals significant differences after 40 minutes asleep in fed flies (N = 28 each sleep bin; p < .05) and differences in starved flies beyond 55 minutes (N = 25 each sleep bin; p < .05). (F) Regression analysis model comparing percent change in MR versus sleep duration, binned per 5 minutes reveals a correlation in trsnnull fed flies (N = 28; R2 = 0.201), but only a weak effect in trsnnull starved flies (N = 25; R2 = 0.183). Gray dashed lines indicate 95% confidence interval of each line. Comparison of the regression lines indicates that the slopes do not differ between the trsnnull fed versus starved state (F = 5.0557, p < .05). One-way ANOVA comparing the initial percent change in MR at the 10-minute sleep bin to each subsequent sleep bin within each group reveals significant differences after 25 minutes asleep in trsnnull fed flies (N = 28 each sleep bin; p < .05) and differences in trsnnull starved flies beyond 30 minutes (N = 25 each sleep bin; p < .05). ANOVA = analysis of variance.

