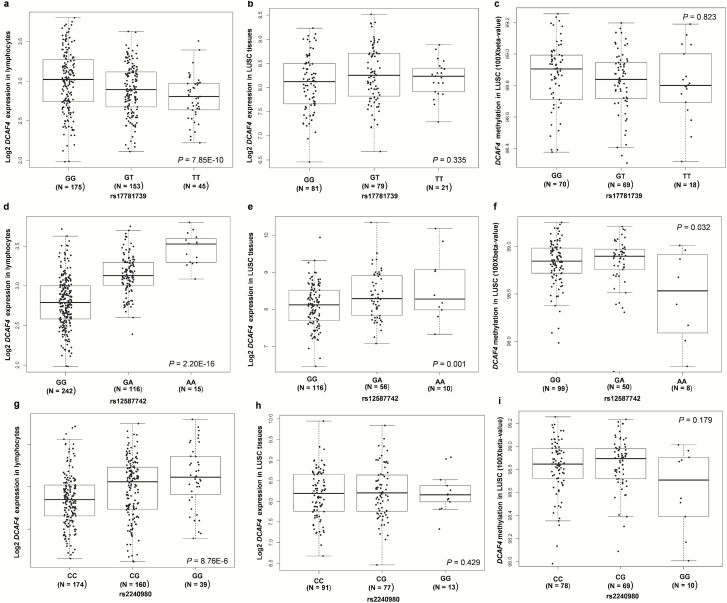
Figure 3.
Correlations of the three SNPs with DCAF4 mRNA expression and methylation status in blood cells and tumor tissues. Correlation between DCAF4 mRNA expression and (a) rs17781739; (d) rs12587742; (g) rs2240980 in 373 blood cells from 373 Europeans individuals in 1000 genomes project (P = 7.85 × 10⁻¹⁰, 2.20 × 10⁻¹⁶ and 8.76 × 10⁻⁶, respectively). Boxplots of DCAF4 mRNA expression and (b) rs17781739; (e) rs12587742; (h) rs2240980 in 182 lung squamous cell carcinomas (LUSC) tumor tissues from The Cancer Genome Atlas (TCGA) database (P = 0.335, 0.001 and 0.429, respectively). Boxplots of DCAF4 methylation status and (c) rs17781739; (f) rs12587742; (i) rs2240980 in 157 LUSC tumor tissues from the TCGA database (P = 0.823, 0.032 and 0.179, respectively).

